Requirement Stability Index
1. Introduction:
This document explains how to analyze and visualize the clarity and stability of requirement changes using the Stability Index metric. It's a ratio calculated by dividing the number of issues where neither the description nor acceptance criteria have changed by the total number of issues. It's presented as a line chart to show trends over time.
Monitoring the Stability Index provides valuable insights into identifying issues prone to change, ensuring well-defined requirements, and promoting efficient development.
2. Definitions:
- Stability Index: The percentage of issues where neither the description nor acceptance criteria have been modified.
- Requirement Changes: Modifications to the initial description or acceptance criteria of an issue after it has been created.
3. Explanation of Charts:
KPI Card:
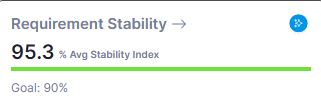
Detailed Chart:
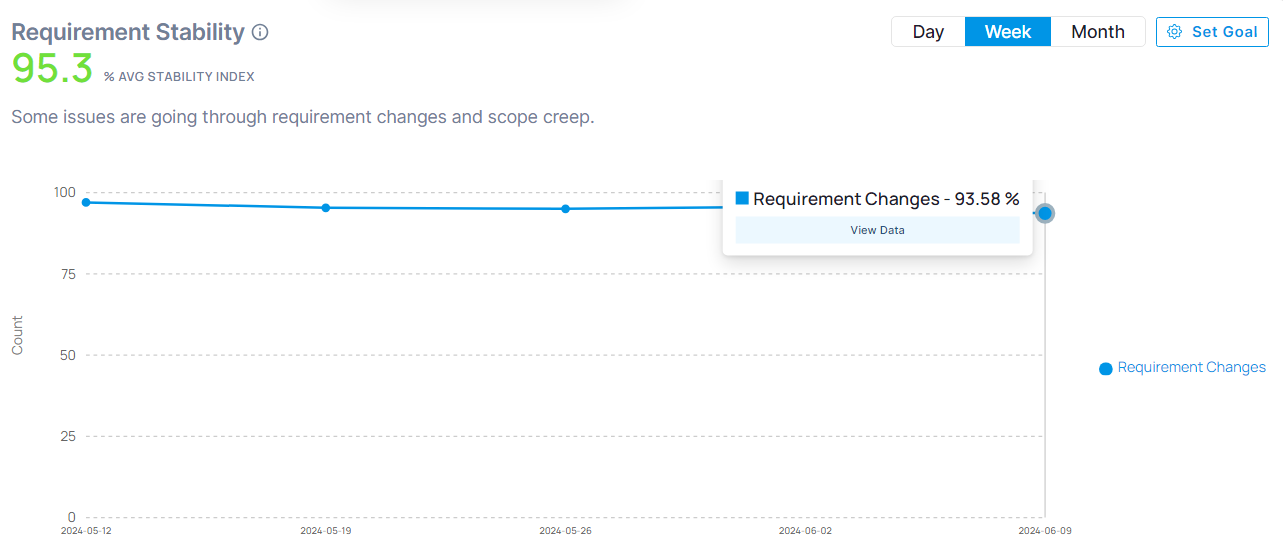
The line chart displays the Stability Index over a chosen timeframe (e.g., weeks, months).
- Horizontal Axis: Represents time intervals.
- Vertical Axis: Represents the Stability Index percentage (0% to 100%).
- Line : Shows the trend across each timeframe bucket
4. Interpretation:
Identifying Unstable Issues: The Stability Index line chart helps visualize trends in requirement changes over time.
- Low Stability Index (Red): This may indicate frequent changes to descriptions or acceptance criteria, potentially leading to confusion, rework, and development delays. Investigate the reasons behind these changes and implement strategies for clearer requirement definition.
- Moderate Stability Index (Amber): While some issues remain stable, there's room for improvement in requirement gathering and communication. Consider conducting workshops or implementing templates to ensure clear and concise requirements upfront.
- High Stability Index (Green): This suggests well-defined, stable issues with minimal changes after creation. Analyze the practices that contribute to this stability and share them within the team.
5. Key Points:
- Requirement Clarity: The Stability Index helps assess the clarity and stability of requirement changes within your project.
- Development Efficiency: A high Stability Index contributes to smoother development by minimizing rework due to requirement changes.
- Communication & Collaboration: Monitoring the Stability Index can reveal gaps in communication or requirement gathering processes.
6. Conclusion:
Monitoring the Stability Index provides valuable insights into the clarity and stability of your requirements. By analyzing trends and taking corrective actions when necessary, you can ensure clear requirement definition, minimize rework, and promote a more efficient development process.