Open Issue Age
1. Introduction:
Issue ageing refers to the time an issue spends in the "InProgress" state, indicating it's being actively worked on but not yet completed. Tracking this metric helps you understand your team's efficiency in completing work and identify potential bottlenecks in your workflow. This document will explore the issue ageing using a horizontal stacked bar chart:
- Horizontal axis: Represents the "InProgress" state duration (time buckets).
- Vertical axis: Shows the number of issues within each time bucket.
- Stacked bars: Each bar represents a time bucket, further divided and stacked by issue priority (e.g., high, medium, low).
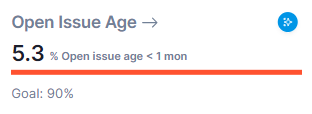
KPI Card:
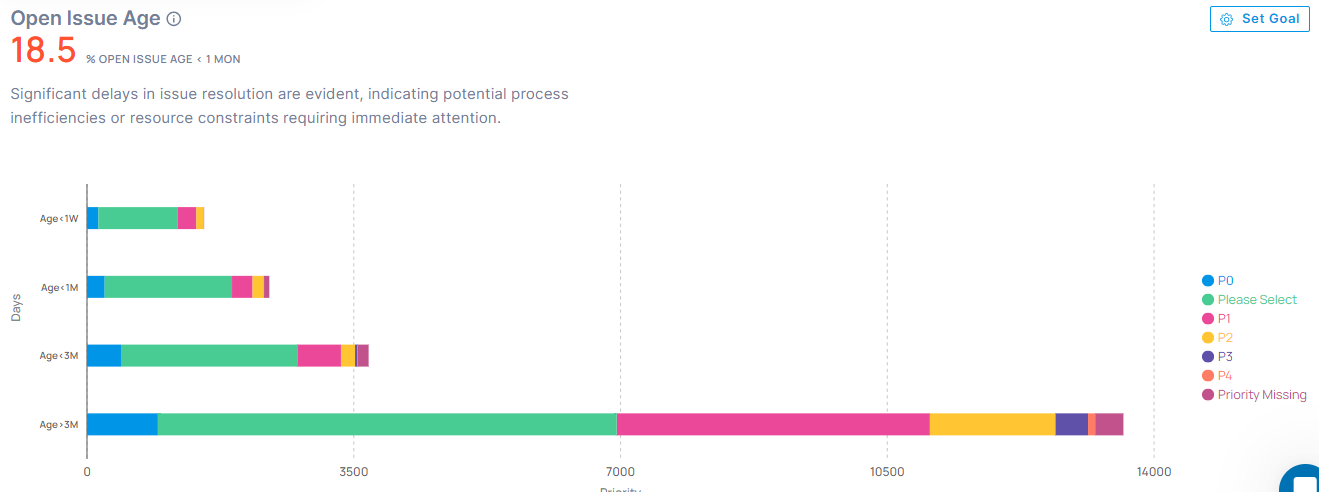
Detailed Chart:
2. Definitions:
- Issue/Ticket: A unit of work representing a problem, bug, feature request, or any other item requiring attention.
- InProgress: The state indicating an issue is actively being worked on.
- Priority: The assigned importance level of an issue (e.g., high, medium, low).
- Time buckets: Defined periods for analysis (e.g., less than 1 week, less than 1 month, etc.).
3. Explanation of Chart:
The Horizontal Stacked Bar Chart provides insights into issue resolution time and prioritization:
- Each bar segment represents the number of issues within a specific time bucket (e.g., less than 1 week).
- Different colors or textures within each bar represent the breakdown by issue priority.
- Longer bars or larger segments indicate more issues experiencing delays in specific timeframes.
- Analyze the distribution of colors/textures within each bar to understand priority-wise ageing trends.
4. Interpretation:
- Overall ageing: Observe the relative sizes of segments across bars to identify timeframes with the most InProgress issues.
- Priority impact: Analyze how priority distribution changes within each time bucket. Are high-priority issues resolving faster than lower priorities?
- Bottlenecks: Identify bars with large segments, especially for high-priority issues, to investigate potential workflow hurdles.
- Improvement trends: Track changes over time to monitor progress in reducing issue ageing within different timeframes and priorities.
5. Key Points:
- This analysis helps identify issues potentially stuck in your workflow and prioritize efforts for improvement.
- Understanding ageing by priority helps ensure critical issues are resolved promptly.
- Continuously monitor and analyze this metric to improve your team's efficiency and reduce issue backlogs.
6. Additional Considerations:
- You can segment the data by issue type, assignee, or project for deeper insights.
- Track additional metrics like average resolution time or cycle time for further analysis.
- Combine this analysis with other data sources like team capacity and workload to understand factors influencing ageing.
7. Conclusion:
Monitoring and analyzing issue ageing provides valuable insights into your team's ability to efficiently complete work. By understanding the data and taking action based on the findings, you can optimize your workflows, prioritize effectively, and ensure timely resolution of issues, ultimately leading to a more productive and responsive team.