Pull Request Size
1. Introduction:
This document explains how to analyze and visualize the average size of code changes using the Pull Request Size metric. It's represented as a line chart showing the average number of lines changed (additions + deletions) per pull request over time (daily, weekly, or monthly). This metric provides valuable insights into code review efficiency, potential quality and security risks, and opportunities for improved development practices.
2. Definitions:
- Pull Request (PR): A formal request to integrate code changes from a branch into the main codebase.
- Line Change: Represents the total number of lines added and deleted within a codebase modification.
- Pull Request Size: The average number of lines changed (additions + deletions) per pull request within a specific timeframe (e.g., day, week, month).
3. Explanation of Charts:
Detailed Chart:
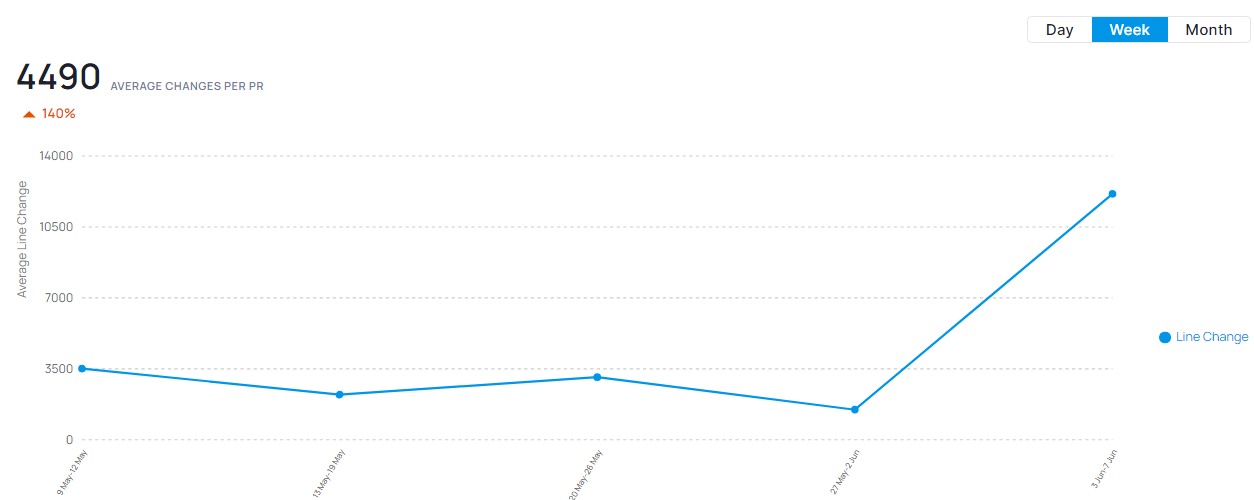
The line chart displays the average Pull Request Size over a chosen timeframe.
- Horizontal Axis: Represents time intervals (e.g., days, weeks, months).
- Vertical Axis: Represents the average number of lines changed per pull request.
- Trend Line: Shows the average size of pull requests over time.
4. Interpretation:
Identifying Code Review Efficiency: Pull Request Size can influence code review efficiency.
- Decreasing Trend: A downward trend may indicate smaller pull requests, potentially leading to more focused reviews and faster turnaround times.
- Increasing Trend: An upward trend suggests larger pull requests, which could require more review effort and potentially introduce higher risk of undetected issues.
Potential Quality and Security Risks:
- Larger pull requests might make it harder to identify and fix bugs, potentially leading to quality issues.
- They may also increase the chance of introducing security vulnerabilities that go unnoticed during review.
Improved Development Practices:
- Smaller pull requests often indicate a more granular development approach, allowing for better code organization and easier comprehension during review.
- This can lead to improved code maintainability and potentially faster development cycles.
5. Key Points:
- Review Efficiency: Monitor Pull Request Size to assess code review efficiency and identify opportunities for improvement.
- Quality and Security: Analyze trends to manage potential risks associated with large pull requests.
- Development Practices: Track this metric to encourage and support the creation of smaller, more focused pull requests.
6. Conclusion:
Monitoring Pull Request Size provides valuable insights into your code review practices and potential risks associated with code changes. By analyzing trends and taking corrective actions when necessary, you can optimize review processes, improve code quality and security, and promote efficient development practices within your team.
Additional Considerations:
- The interpretation of trends may depend on factors like project complexity, team size, and coding standards.
- Consider using this metric in conjunction with other metrics (e.g., code churn, pull request lead time) for a more comprehensive view of your development workflow and code health.