PR Review Health
1. Introduction:
This document explains how to analyze and visualize the effectiveness of your code review process using the PR Review Rate metric. It's a ratio calculated by dividing the number of Pull Requests (PRs) merged with a review by the total number of reviewed PRs.
Monitoring PR Review Rate provides valuable insights into identifying potential bottlenecks, assessing collaboration effectiveness, and ensuring a smooth development workflow.
2. Definitions:
- Pull Request (PR): A proposed modification to a codebase that is submitted for review before being merged into the main branch.
- PR Review Rate : The percentage of reviewed PRs that are successfully merged into the codebase. It is calculated as: (Number of PRs Merged with Review) / (Number of Reviewed PRs).
3. Explanation of Charts:
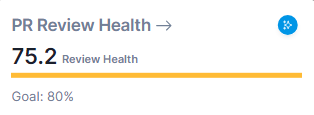
KPI Card:
Detailed Chart;
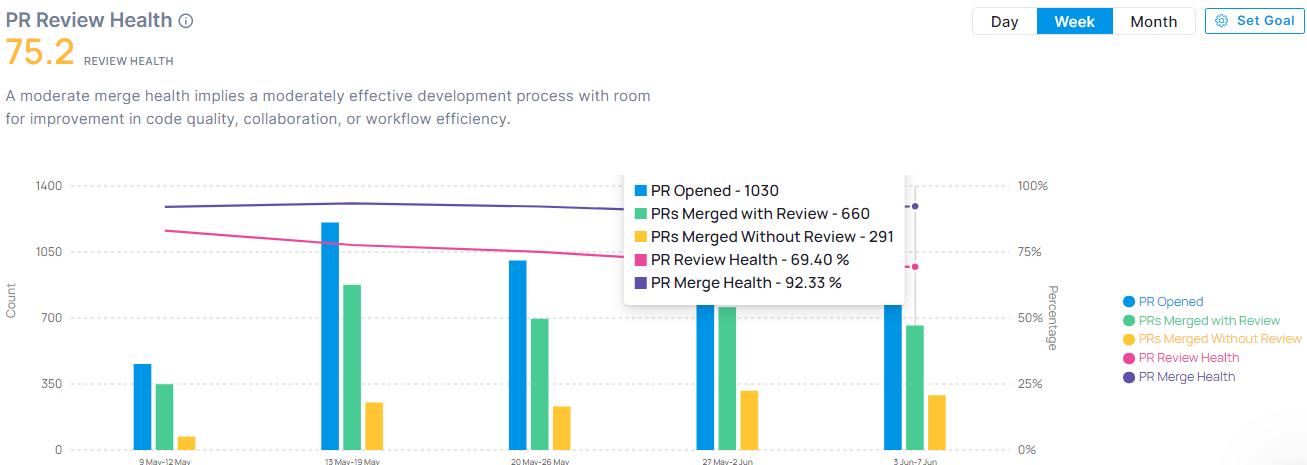
The image represents the PR Review Rate for your project. It includes the following details:
- Horizontal Axis: Represents time intervals (e.g., weeks, months).
- Vertical Axis 1 (left): Represents the percentage of PR Rate .
- Vertical Axis 2 (right): Represents the total number of PRs
- Bar 1: Number of PRs opened in the selected timeframe.
- Bar 2: Number of PRs merged with Review
- Bar 3: Number of PRs merged without review
- Pink Line: PR review Rate
- Purple Line: PR Merge Rate
4. Interpretation:
Identifying Trends: The PR Review Rate chart helps visualize trends in the effectiveness of your code review process over time.
- Low PR Review Rate (Red): This may indicate challenges in areas like code quality, collaboration, resource availability, or inefficient workflows. Investigate further to identify specific bottlenecks and implement improvements.
- Moderate PR Review Rate (Amber): This suggests there's room for improvement in code quality, collaboration, or workflow efficiency. Consider training initiatives or streamlining review processes.
- High PR Review Rate (Green): This indicates a well-functioning code review process with successful merge rates and potentially high-quality code. Analyze if there are best practices to share and maintain this efficiency.
5. Key Points:
- Process Efficiency: PR Review Rate helps assess the effectiveness of your code review process and identify areas for improvement.
- Code Quality: A high PR Review Rate suggests a focus on code quality during the review process.
- Collaboration & Workflow: Monitoring PR Review Rate can reveal issues with collaboration or workflow bottlenecks that hinder successful merges.
6. Conclusion:
Monitoring PR Review Rate provides valuable insights into the health of your code review process. By analyzing trends and taking corrective actions when necessary, you can identify and address bottlenecks, improve collaboration, and optimize your workflow to achieve a smooth and efficient development process.