Issue Throughput
1. Introduction:
Issue throughput refers to the rate at which you resolve your issues/tickets. Tracking this metric helps you understand your team's effectiveness in handling problems and delivering solutions. This document will explore the issue throughput using visualization:
2. Definitions:
- Issue/Ticket: A unit of work representing a problem, bug, feature request, or any other item requiring attention.
- Created: When an issue is first logged in your system.
- Closed: When an issue is resolved and marked as completed.
- Throughput: The number of closed issues divided by the number of created issues.
- Cumulative: Represents the total number of issues since the beginning of the analysis period (e.g., week, month).
3. Explanation of Charts:
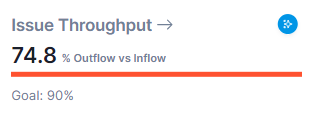
KPI Card:
Detailed Chart:
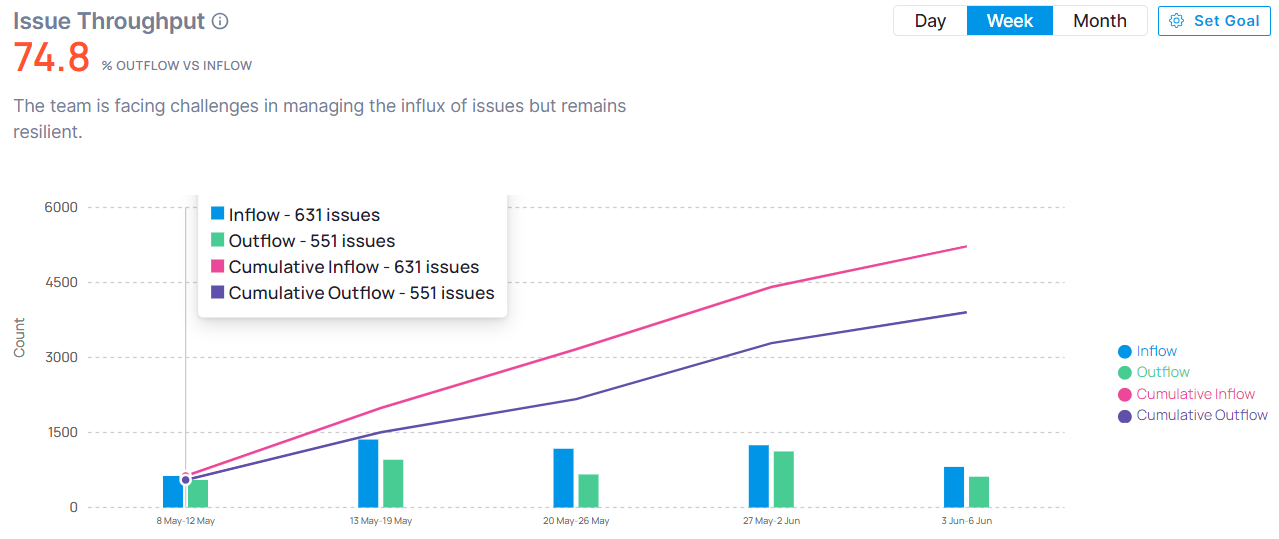
The Line and Bar Chart provides a combined view of issue creation and resolution activity:
- Horizontal axis: Represents time (e.g., weeks).
- Vertical axis (left): Shows the cumulative number of issues (lines).
- Pink line: Cumulative created issues.
- Purple line: Cumulative closed issues.
- Vertical axis (right): Shows the number of issues created and closed per week (bars).
- Blue bars: Inflow-Issues created each week.
- Green bars: Outflow-Issues closed each week.
4. Interpretation:
- Overall trend: Analyze the slope of the cumulative lines. A steeper slope for closed issues indicates faster resolution and higher throughput.
- Weekly fluctuations: Observe the bar graphs to identify periods with high or low creation/resolution activity.
- Gap between lines: A widening gap suggests faster creation than resolution, potentially indicating a backlog.
- Crossing lines: If the closed line crosses the created line, it signifies periods where more issues are resolved than created, reducing the backlog.
5. Key Points:
- This analysis helps identify trends and potential bottlenecks in your issue resolution process.
- A healthy throughput requires balancing issue creation with timely resolution.
- Continuously monitor and analyze this metric to improve your team's efficiency and responsiveness to issues.
6. Conclusion:
Tracking and analyzing issue throughput provides valuable insights into your team's ability to manage and resolve problems effectively. By understanding the data and taking action based on the findings, you can optimize your workflows, improve efficiency, and ensure timely resolution of issues, ultimately leading to a more productive and responsive team.