PR Comment Count
1. Introduction:
This document explains how to analyze and visualize the level of code review discussion using the Pull Request Comment Count metric. It's represented as a line chart showing the average number of comments per pull request over time (daily, weekly, or monthly). This metric provides valuable insights into the thoroughness of code reviews, potential areas for improvement in code clarity, and indirectly assesses documentation quality.
2. Definitions:
- Pull Request (PR): A formal request to integrate code changes from a branch into the main codebase.
- Pull Request Comment: A message left by a reviewer on a pull request to provide feedback, ask questions, or suggest improvements.
- Pull Request Comment Count: The average number of comments left on pull requests within a specific timeframe (e.g., day, week, month).
3. Explanation of Charts:
Detailed Chart:
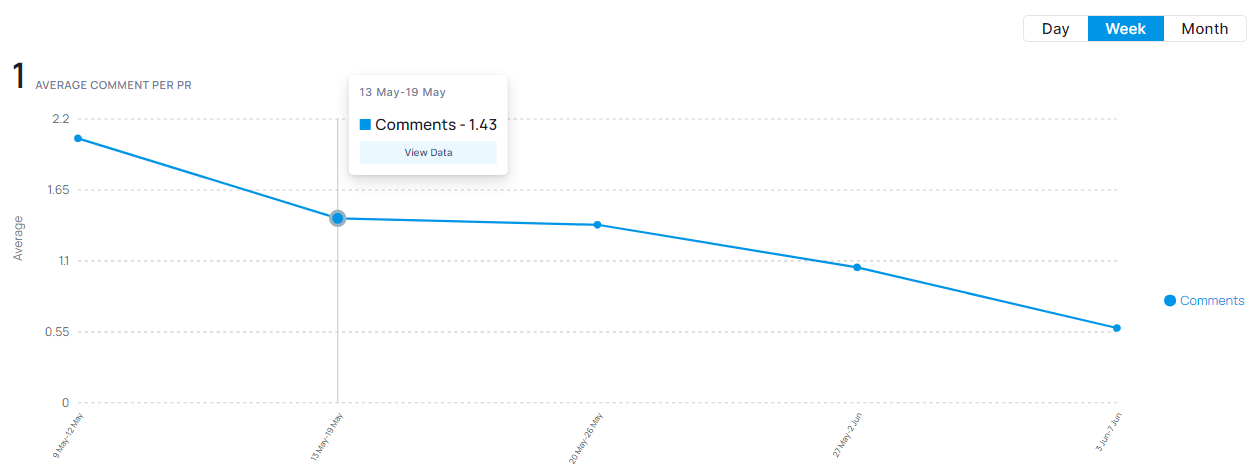
The line chart displays the average number of comments per pull request over a chosen timeframe.
- Horizontal Axis: Represents time intervals (e.g., days, weeks, months).
- Vertical Axis: Represents the average number of comments per pull request.
- Trend Line: Shows the average rate of comments per pull request over time.
4. Interpretation:
Identifying Code Review Thoroughness: The chart helps visualize trends in the level of discussion and feedback provided during code reviews.
- Increasing Trend: An upward trend may indicate more thorough code reviews, deeper code analysis, or a focus on improving code quality.
- Decreasing Trend: A downward trend could suggest less comprehensive reviews, reduced code scrutiny, or potential communication issues within the team.
Indirect Assessment of Documentation Quality: While not a direct measure, a higher Pull Request Comment Count can indirectly suggest areas where code clarity or documentation might need improvement, leading to more reviewer questions or discussions.
5. Key Points:
- Code Review Insights: Track Pull Request Comment Count to gain insights into the thoroughness and effectiveness of code reviews.
- Code Clarity and Documentation: Monitor this metric alongside code quality metrics to identify potential areas for improvement in code clarity or documentation.
- Communication and Collaboration: Analyze trends to assess communication patterns and collaboration during code reviews.
6. Conclusion:
Monitoring Pull Request Comment Count provides valuable insights into the quality and effectiveness of your code review process. By analyzing trends and taking corrective actions when necessary, you can optimize code reviews, improve code quality, and ensure clear and well-documented code.
Additional Considerations:
- The interpretation of trends may depend on factors like project complexity, team size, and code review guidelines.
- Consider using this metric in conjunction with other metrics (e.g., code churn, pull request lead time) for a more comprehensive view of your development workflow and code quality.