Average Active Days
1. Introduction:
This document explains how to analyze and visualize developer engagement and activity levels within your project using the Active Dev Days metric. It represents the average number of days per contributor where they made a git contribution (e.g., PR reviews, PR comments, or commits) over a chosen timeframe.
Monitoring Active Dev Days provides valuable insights into identifying potential challenges with team engagement, optimizing workflows, and ensuring a healthy development environment.
2. Definitions:
- Active Dev Day: A day on which a contributor makes at least one git contribution (PR review, PR comment, or commit).
- Active Dev Days: The average number of days per contributor with at least one git contribution over a specific timeframe (e.g., week, month, or quarter).
3. Explanation of Charts:
KPI Card:

Detailed Chart:
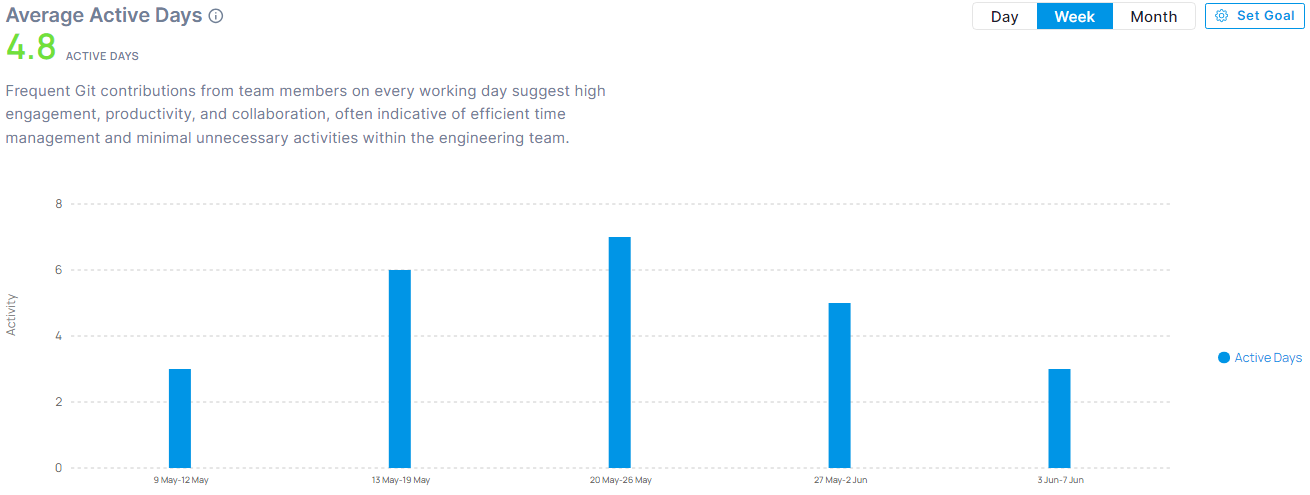
The chart displays the distribution of average active dev days for your team members over a chosen time range.
- Horizontal Axis: Represents the timeframe distribution (daily, weekly, monthly).
- Vertical Axis: Represents the average of active days for all contributors for a particular time frame.
Color Indicators:
- Green: High Average Active Dev Days (indicating frequent contributions)
- Amber: Moderate Average Active Dev Days (indicating some contributors with potentially lower engagement)
- Red: Low Average Active Dev Days (indicating potential challenges with contributor availability)
4. Interpretation:
Identifying Engagement Trends: The Active Dev Days chart helps visualize overall team engagement and potential areas for improvement.
- Low Average Active Dev Days (Red): This may suggest part-time commitments, reduced availability, or other constraints impacting team productivity and dynamics. Investigate further to understand the reasons and provide support if needed.
- Moderate Active Dev Days (Amber): This could indicate focused work patterns, but also suggests room to optimize for improved consistency and engagement across the team. Consider workflow adjustments or team communication initiatives.
- High Average Active Dev Days (Green): This suggests high overall engagement, productivity, and collaboration among team members. Analyze if this reflects efficient time management and identify best practices to share within the team.
5. Key Points:
- Team Engagement: Active Dev Days provide a general indicator of developer engagement and workload distribution within your project.
- Project Health: Monitoring trends in Active Dev Days can help identify potential challenges that might impact project progress.
- Process Optimization: By analyzing Active Dev Days, you can identify opportunities to improve workflows and overall team productivity.
6. Conclusion:
Monitoring Active Dev Days provides valuable insights into developer engagement and activity levels within your project. By analyzing the distribution and taking corrective actions when necessary, you can address challenges, optimize workflows, and foster a more productive and collaborative development environment.
Additional Considerations:
- Consider analyzing Active Dev Days alongside other metrics (e.g., commits per day, code churn) for a more comprehensive view of team activity.
- Investigate the reasons behind low or high Active Dev Days to identify specific areas for improvement or knowledge sharing.