Pull Request Open Count
1. Introduction:
This document explains how to analyze and visualize the incoming development workload using the Pull Request Open Count metric. It's represented as a line chart showing the number of pull requests opened over time (daily, weekly, or monthly). This metric provides valuable insights into team workload management, development activity, and potential resource allocation needs.
2. Definitions:
- Pull Request (PR): A formal request to integrate code changes from a branch into the main codebase.
- Pull Request Open Count: The number of pull requests opened within a specific timeframe (e.g., day, week, month).
3. Explanation of Charts:
Detailed Chart:
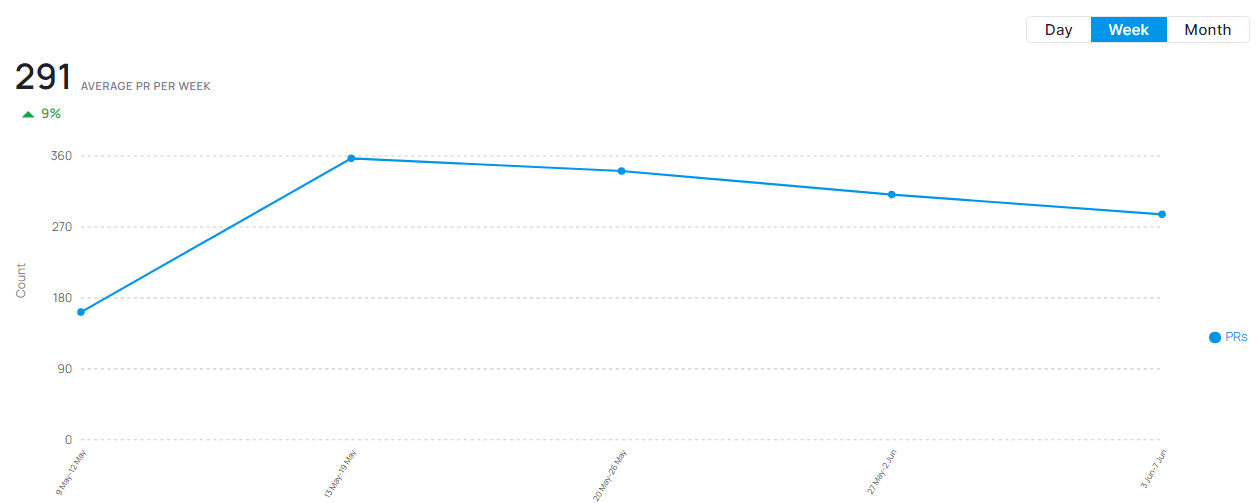
The line chart displays the Pull Request Open Count over a chosen timeframe.
- Horizontal Axis: Represents time intervals (e.g., days, weeks, months).
- Vertical Axis: Represents the number of pull requests opened.
- Trend Line: Shows the average rate of pull request openings over time.
4. Interpretation:
Identifying Development Activity: The line chart helps visualize trends in the rate of new code contributions.
- Increasing Trend: An upward trend may indicate increased development activity, new feature development, or bug fixes.
- Decreasing Trend: A downward trend could suggest reduced development activity, completion of major features, or potential roadblocks in the development process.
- Flat Trend: A flat line may indicate a consistent workflow, but also a lack of significant changes in development activity.
Workload Management: Monitor Pull Request Open Count to assess team workload and identify potential resource allocation needs.
- High Open Count: A consistently high number of open pull requests might suggest the team is overloaded and could benefit from additional resources or prioritization strategies.
- Sudden Spikes: A sudden surge in pull requests might require temporary adjustments in resource allocation or scheduling to manage the workload effectively.
Additional Use Cases:
- Identifying Bottlenecks: Analyze trends alongside Pull Request Lead Time (time taken to close a pull request) to identify potential bottlenecks or delays in the code review process.
- Release Planning: Track Pull Request Open Count to anticipate upcoming workload and inform release planning and scheduling decisions.
5. Key Points:
- Workload Insights: Track Pull Request Open Count to gain insights into team workload and development activity.
- Resource Allocation: Monitor this metric to ensure efficient resource allocation and prevent team overload.
- Planning and Prioritization: Analyze trends to inform decision making around project planning and prioritization.
6. Conclusion:
Monitoring Pull Request Open Count provides valuable insights into your team's development workflow and workload. By analyzing trends and taking corrective actions when necessary, you can optimize resource allocation, manage workload effectively, and ensure smooth development progress.
Additional Considerations:
- The interpretation of trends may depend on factors like project phase, team size, and development cycles.
- Consider using this metric in conjunction with other metrics (e.g., Pull Request Lead Time, Pull Request Merge Count) for a more comprehensive view of your development workflow and team capacity.