Backward Momentum
1. Introduction:
This document explains how to analyze and visualize the efficiency of your team's issue resolution process using the Backward Momentum metric. It's calculated as the ratio of issues moved to upstream statuses (e.g., "Blocked" or "In Review") compared to tickets moved to downstream statuses (e.g., "In Progress" or "Done"). It's presented as a bar chart with breakdowns for different backward movements.
Monitoring Backward Momentum provides valuable insights into identifying persistent roadblocks, assessing the effectiveness of issue resolution, and promoting a smooth workflow.
2. Definitions:
- Backward Momentum: The ratio of issues that move to upstream statuses (indicating setbacks) compared to those that move to downstream statuses (indicating progress).
3. Explanation of Charts:
KPI Card:
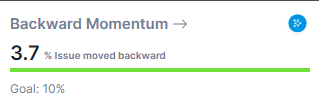
Detailed Chart:
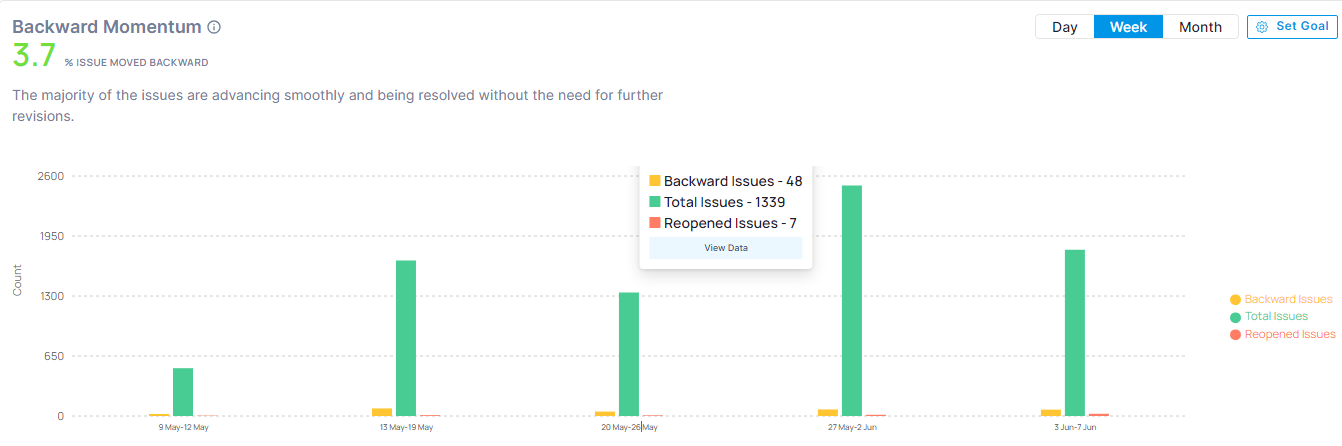
The bar chart displays the distribution of issues that moved backward in your workflow:
- Total Issues: The total number of issues in that timeframe
- Issues Moved Backward: The total number of issues that regressed from a downstream status (e.g., "In Progress" or "Done") to an upstream status (e.g., "Blocked" or "In Review").
- Reopened Issues: The number of issues that transitioned from a "Done" state back to an "In Progress" state.
Color Indicators:
- Green: Less than 10% of total issues moved backward (indicating a well-functioning workflow with minimal setbacks).
- Amber: Between 10% and 30% of total issues moved backward (indicating some challenges with issue resolution that might benefit from improvement).
- Red: More than 30% of total issues moved backward (indicating significant roadblocks or inefficiencies in the workflow that require attention).
4. Interpretation:
Identifying Roadblocks: Analyzing Backward Momentum helps identify persistent obstacles that hinder progress.
- High Percentage of Backward Movement (Red): This may indicate unresolved dependencies, frequent bug discoveries, or unclear requirements that cause rework. Investigate the reasons behind backward movements and implement solutions.
- Moderate Backward Movement (Amber): While the workflow functions, there's room for improvement in issue resolution or communication. Consider process adjustments or knowledge-sharing initiatives.
- Low Backward Movement (Green): This suggests a well-functioning workflow with efficient issue resolution and minimal setbacks. Analyze if there are best practices to share and maintain this efficiency.
5. Key Points:
- Workflow Efficiency: Backward Momentum helps assess your team's ability to address and resolve challenges that arise during the development process.
- Improved Progress: By minimizing backward movements, you can ensure smoother workflow and faster completion of tasks.
- Proactive Issue Resolution: Monitoring Backward Momentum encourages a proactive approach to identifying and resolving issues before they significantly impact progress.
6. Conclusion:
Monitoring Backward Momentum provides valuable insights into the effectiveness of your team's issue resolution process. By analyzing the distribution and taking corrective actions when necessary, you can identify and address roadblocks, improve workflow efficiency, and ensure your team progresses steadily towards project goals.