Issue Cycle Time Spread
1. Introduction:
This document explains how to analyze and visualize the efficiency of your issue resolution process using the Issue Cycle Time Spread metric. It categorizes resolved issues based on the time taken to resolve them (cycle time) and presents the distribution in a pie chart.
Monitoring Issue Cycle Time Spread provides valuable insights into identifying bottlenecks in your issue resolution process, prioritizing improvements, and ensuring timely completion of tasks.
2. Definitions:
- Issue: A unit of work representing a bug, feature request, or task within your project management system.
- Issue Cycle Time: The time elapsed between the creation and resolution (closure) of an issue.
3. Explanation of Charts:
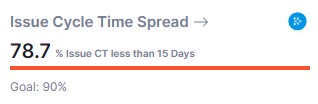
KPI Card:
Detailed Chart:
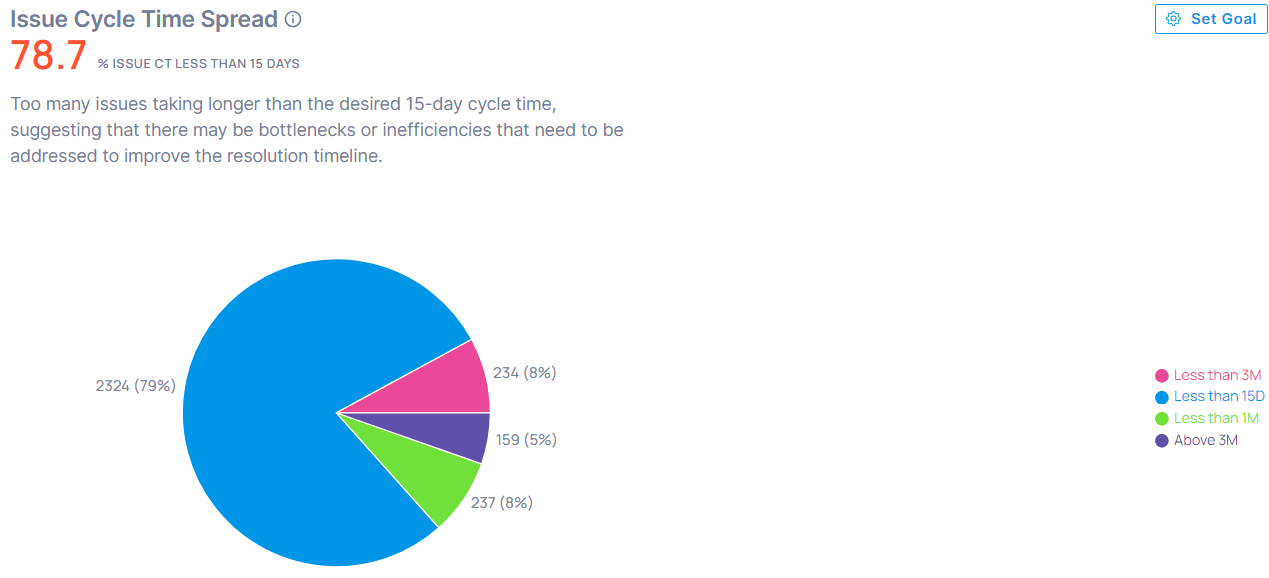
The pie chart displays the distribution of resolved issues across different cycle time categories:
- Less than 15 Days: Issues resolved within 15 days of creation.
- Less than 1 Month: Issues resolved between 15 days and 1 month (not including the 15th day).
- Less than 3 Months: Issues resolved between 1 month and 3 months (not including the 1st month).
- Above 3 Months: Issues resolved in more than 3 months.
Color Indicators:
- Green: More than 90% of issues are resolved within 15 days (indicating a highly efficient issue resolution process).
- Amber: Between 80% and 90% of issues are resolved within 15 days (indicating room for improvement in resolving some issues faster).
- Red: Less than 80% of issues are resolved within 15 days (indicating significant delays in resolving a large portion of issues).
4. Interpretation:
Identifying Bottlenecks: The Issue Cycle Time Spread pie chart helps visualize the distribution of issue resolution times.
- High Percentage of Long Resolution Times (Red): This may indicate bottlenecks in the workflow, complex issues requiring additional investigation, or resource limitations. Investigate the reasons behind long cycle times and implement solutions.
- Moderate Distribution (Amber): While some issues are resolved quickly, there's potential to improve the efficiency of resolving others. Consider process changes, prioritization strategies, or knowledge-sharing initiatives.
- Favorable Distribution (Green): This suggests a well-functioning issue resolution process with most issues being addressed promptly. Analyze if there are best practices to share and maintain this efficiency.
5. Key Points:
- Process Efficiency: Issue Cycle Time Spread helps assess the overall timeliness of your issue resolution process.
- Prioritization: By identifying long resolution times, you can prioritize addressing bottlenecks and focus on improving efficiency for complex issues.
- Continuous Improvement: Monitoring Issue Cycle Time Spread allows you to track progress and identify areas for ongoing improvement in your workflow.
6. Conclusion:
Monitoring Issue Cycle Time Spread provides valuable insights into the efficiency of your issue resolution process. By analyzing the distribution and taking corrective actions when necessary, you can identify bottlenecks, improve resolution times, and ensure your team delivers work in a timely manner.