Pull Request Review Count
1. Introduction:
This document explains how to analyze and visualize the rate of code review activity using the Pull Request Review Count metric. It's represented as a line chart showing the average number of pull requests reviewed by at least one reviewer over time (daily, weekly, or monthly). This metric provides valuable insights into code review efficiency, potential areas for improvement in code quality, and potential bottlenecks in the development workflow.
2. Definitions:
- Pull Request (PR): A formal request to integrate code changes from a branch into the main codebase.
- Pull Request Review: An evaluation of a pull request by one or more reviewers, providing feedback on code quality, adherence to coding standards, and potential issues.
- Pull Request Review Count: The average number of pull requests reviewed by at least one reviewer within a specific timeframe (e.g., day, week, month).
3. Explanation of Charts:
Detailed Charts:
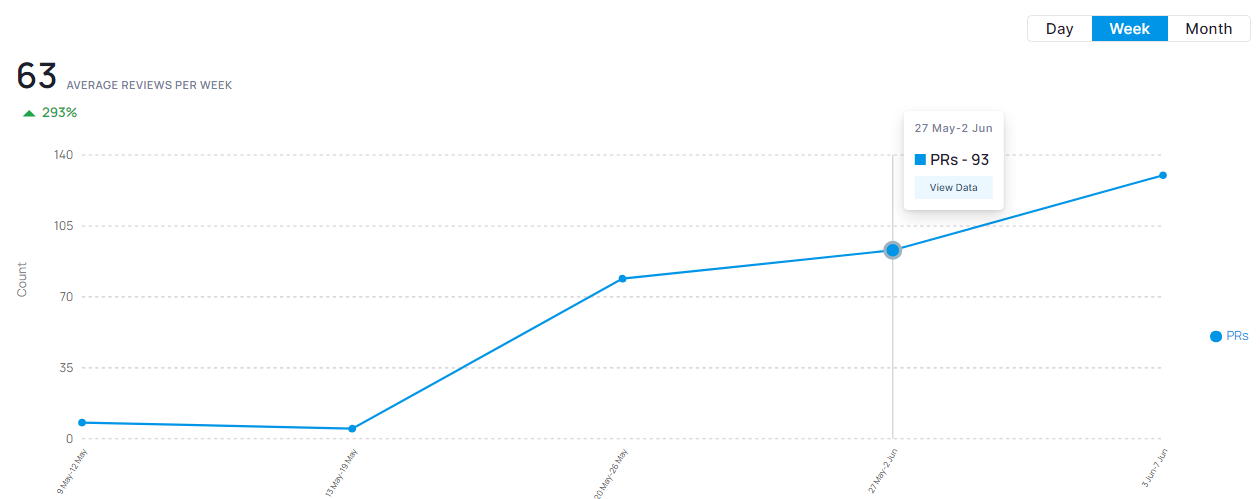
The line chart displays the Pull Request Review Count over a chosen timeframe.
- Horizontal Axis: Represents time intervals (e.g., days, weeks, months).
- Vertical Axis: Represents the number of pull requests reviewed by at least one reviewer.
- Trend Line: Shows the average rate of pull request reviews over time.
4. Interpretation:
Identifying Code Review Activity: The line chart helps visualize trends in the rate of code review completions.
- Increasing Trend: An upward trend may indicate increased development activity, more frequent code reviews, or a growing team.
- Decreasing Trend: A downward trend could suggest reduced development activity, less frequent code reviews, or potential bottlenecks in the development process that are delaying reviews.
- Flat Trend: A flat line may indicate a consistent workflow, but also a lack of significant changes in code review activity.
Review Quality and Coding Best Practices:
- A healthy Pull Request Review Count, along with other code quality metrics, can suggest good code review practices and adherence to coding standards.
Leading Indicator for Quality Issues:
- A sudden decrease in Pull Request Review Count, along with a high number of Pull Request Open Count (metric not covered in this document, but refers to the number of pull requests opened in a timeframe) could indicate a backlog of code waiting for review, potentially leading to an increase in undetected issues.
5. Key Points:
- Code Review Efficiency: Track Pull Request Review Count to assess code review efficiency and identify areas for improvement.
- Code Quality: Monitor this metric alongside other code quality metrics to get a holistic view of code health.
- Workflow Management: Analyze trends to identify potential bottlenecks in the development workflow that might be delaying code reviews.
6. Conclusion:
Monitoring Pull Request Review Count provides valuable insights into your team's code review activity and potential areas for improvement. By analyzing trends and taking corrective actions when necessary, you can optimize code review processes, improve code quality, and ensure a smooth development workflow.
Additional Considerations:
- The interpretation of trends may depend on factors like project phase, team size, and coding standards.
- Consider using this metric in conjunction with other metrics (e.g., Pull Request Lead Time, Pull Request Merge Count, code churn) for a more comprehensive view of your development workflow, code quality, and team efficiency.