Contributors Working on Non-Working Days
1. Introduction:
This document explains how to analyze and visualize trends in developer activity outside of regular working hours using the Contributors Working on Non-Working Days metric. It's represented as a line chart showing the average number of contributors who commit code on non-working days within a chosen timeframe (daily, weekly, or monthly). This metric provides insights into team health, well-being, workload management, and potential workload distribution issues.
2. Definitions:
- Contributor: An individual who contributes code to the project repository.
- Non-Working Day: A day that falls outside of the team's standard working hours (e.g., weekends, holidays).
- Contributors Working on Non-Working Days: The average number of contributors who commit code to the repository on non-working days within a specific timeframe (e.g., day, week, month).
3. Explanation of Charts:
Detailed Chart:
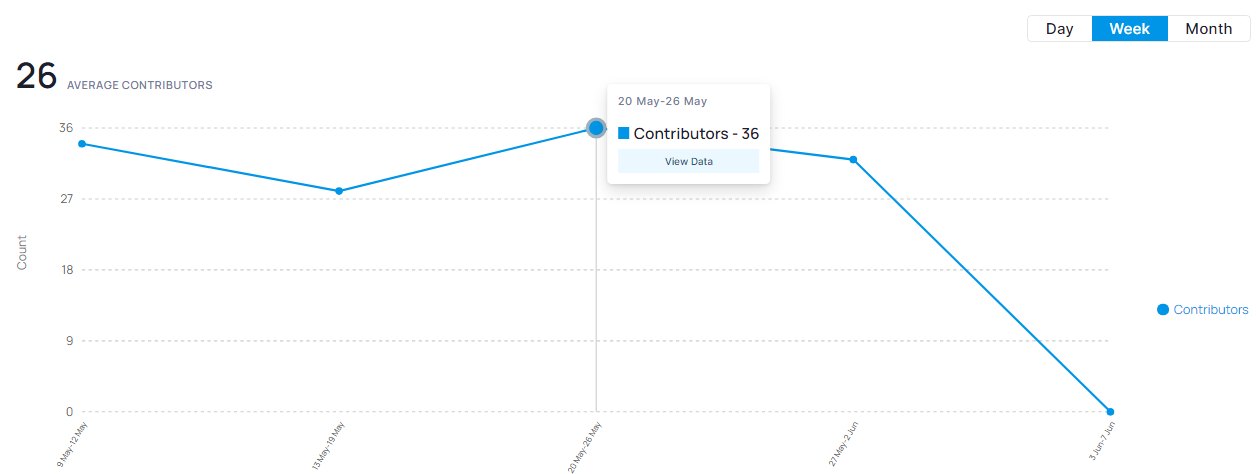
The line chart displays the average number of Contributors Working on Non-Working Days over a chosen timeframe.
- Horizontal Axis: Represents time intervals (e.g., days, weeks, months).
- Vertical Axis: Represents the number of contributors working on non-working days.
- Trend Line: Shows the average rate of contributor activity on non-working days over time.
4. Interpretation:
Team Health and Well-being:
- Low Activity: A consistently low number of contributors working on non-working days might suggest healthy boundaries and good work-life balance within the team.
- High Activity: A sustained high level of activity could indicate potential signs of burnout, workload pressure, or tight deadlines that may be impacting well-being.
Workload Management and Distribution:
- Increasing Trend: An upward trend may suggest increasing workload, tighter deadlines, or potential workload imbalances within the team, leading some to work on non-working days.
- Sudden Spikes: Short-term spikes in activity could be due to urgent fixes, but frequent occurrences might indicate recurring issues with workload distribution or project planning.
5. Key Points:
- Work-Life Balance: Track Contributors Working on Non-Working Days to assess potential workload pressure and promote healthy work-life balance.
- Workload Insights: Monitor this metric to gain insights into workload distribution and identify potential imbalances within the team.
- Project Planning: Analyze trends to inform project planning and ensure realistic deadlines that minimize the need for non-working day activity.
6. Conclusion:
Monitoring Contributors Working on Non-Working Days provides valuable insights into team health, workload management, and potential work-life balance issues. By analyzing trends and taking corrective actions when necessary, you can promote healthy work practices, distribute workload effectively, and ensure sustainable team performance.
Additional Considerations:
- The interpretation of trends may depend on factors like project deadlines, team culture, and individual preferences.
- Consider using this metric in conjunction with other metrics (e.g., code churn, issue resolution time) for a more comprehensive view of team well-being, workload management, and project health.
- Remember, some level of non-working day activity might be expected, especially for passionate developers. Context is crucial for interpreting this metric effectively.