Pull Request Merged Count
1. Introduction:
This document explains how to analyze and visualize the rate of code integration using the Pull Request Merged Count metric. It's represented as a line chart showing the number of pull requests merged over time (daily, weekly, or monthly). This metric provides valuable insights into development activity, code review efficiency, and potential bottlenecks in your integration process.
2. Definitions:
- Pull Request (PR): A formal request to integrate code changes from a branch into the main codebase.
- Pull Request Merged Count: The number of pull requests successfully merged into the main codebase within a specific timeframe (e.g., day, week, month).
3. Explanation of Charts:
Detailed Chart:
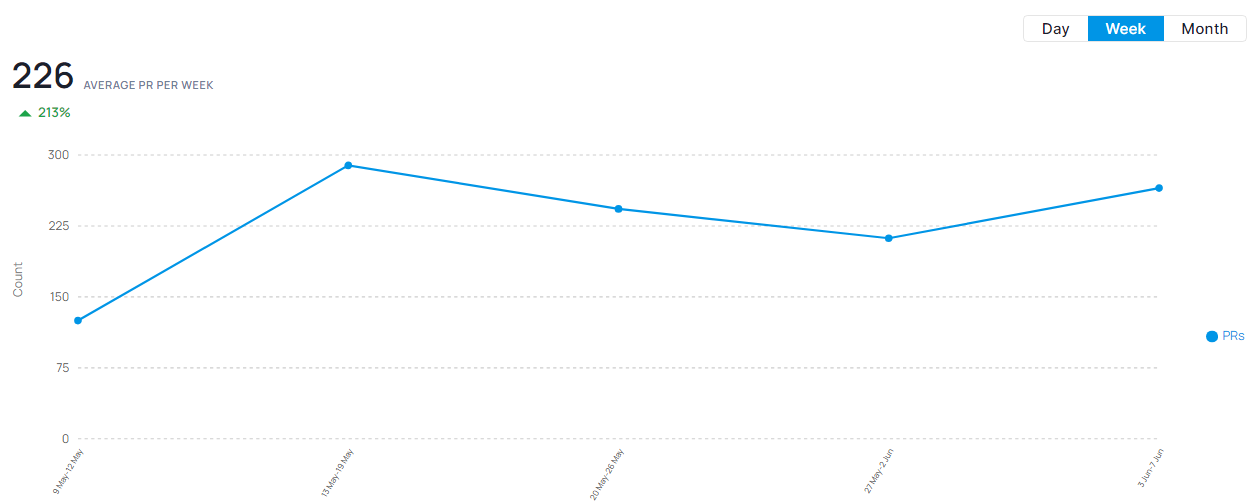
The line chart displays the Pull Request Merged Count over a chosen timeframe.
- Horizontal Axis: Represents time intervals (e.g., days, weeks, months).
- Vertical Axis: Represents the number of pull requests merged.
- Trend Line: Shows the average rate of pull request merges over time.
4. Interpretation:
Identifying Development Activity: The line chart helps visualize trends in code integration activity.
- Increasing Trend: An upward trend suggests increased development activity or improved code review efficiency.
- Decreasing Trend: A downward trend might indicate reduced development activity, slowdowns in code review, or potential integration issues.
- Flat Trend: A flat line may suggest a consistent workflow but could also indicate a lack of improvement or changes in development pace.
5. Key Points:
- Integration Insights: Track Pull Request Merged Count to assess development activity and code review efficiency.
- Identifying Bottlenecks: Analyze trends to identify potential bottlenecks in the pull request review or merge process.
- Collaboration and Workflow: Monitor this metric to ensure smooth collaboration and effective code integration within your team.
6. Conclusion:
Monitoring Pull Request Merged Count provides valuable insights into your team's code integration activity. By analyzing trends and taking corrective actions when necessary, you can optimize your code review process, identify and address bottlenecks, and ensure smooth code integration into the main codebase.
Additional Considerations:
- The interpretation of trends may depend on factors like project phase, team size, and pull request complexity.
- Consider using this metric in conjunction with other metrics (e.g., pull request lead time, code churn) for a more comprehensive view of your development workflow and code quality.