Story Points Completed
1. Introduction:
This document explains how to analyze and visualize team delivery velocity using the Story Points Completed metric. It's represented as a line chart showing the total story points completed for issues within a chosen timeframe (daily, weekly, or monthly). This metric provides valuable insights into team productivity, project scope management, and potential areas for improvement in your Agile development process.
2. Definitions:
- Story Point: A relative unit used in Agile methodologies to estimate the effort required to complete a user story or backlog item.
- Story Points Completed: The total number of story points associated with issues completed within a specific timeframe (e.g., day, week, month).
3. Explanation of Charts:
Detailed Chart:
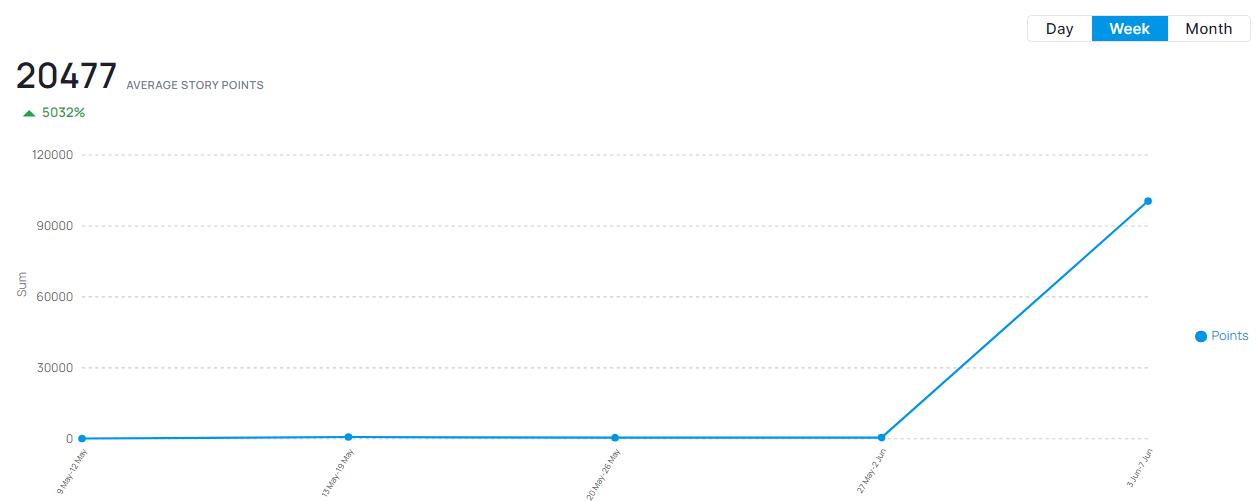
The line chart displays the Story Points Completed over a chosen timeframe.
- Horizontal Axis: Represents time intervals (e.g., days, weeks, months).
- Vertical Axis: Represents the total number of story points completed.
- Trend Line: Shows the average rate of story points completed over time.
4. Interpretation:
Identifying Team Velocity: The line chart helps visualize trends in the team's overall delivery rate based on story points.
- Increasing Trend: An upward trend suggests increasing team velocity, potentially indicating improved efficiency or reduced rework.
- Decreasing Trend: A downward trend could signify reduced team capacity, increased complexity of tasks, or scope creep (adding new features outside the original plan).
- Flat Trend: A flat line may indicate a consistent delivery rate, but also a lack of significant changes in team velocity.
Project Scope Management: Monitor Story Points Completed alongside the remaining story points in your backlog to assess project scope management.
- Significant Deviations: Large discrepancies between planned and completed story points might indicate a need to re-evaluate project scope or adjust future sprint planning.
5. Key Points:
- Delivery Insights: Track Story Points Completed to gain insights into team delivery velocity and identify trends in productivity.
- Agile Process Optimization: Monitor this metric to ensure efficient use of story points and identify areas for improvement in your Agile workflow.
- Project Scope Monitoring: Analyze trends alongside project scope to ensure effective management and potential adjustments.
6. Conclusion:
Monitoring Story Points Completed provides valuable insights into your team's velocity and overall project delivery. By analyzing trends and taking corrective actions when necessary, you can optimize your Agile practices, improve team productivity, and ensure successful project completion within the planned scope.
Additional Considerations:
- The interpretation of trends may depend on factors like team size, project complexity, and sprint lengths.
- Consider using this metric in conjunction with other Agile metrics (e.g., burn down chart, cycle time) for a more comprehensive view of your Agile development process and team performance.