Contributors Getting Burnout
Contributors at Risk of Burnout
1. Introduction:
This document explains how to analyze and visualize potential team member burnout using the Contributors at Risk of Burnout metric. It's represented as a line chart showing the average number of contributors who exhibit high code commit activity over a chosen timeframe (daily, weekly, or monthly). A contributor is flagged as potentially at risk if their activity suggests they are working for an extended period exceeding a predefined threshold.
In this case, the threshold is defined as committing code for 90% of a two-week window (approximately 12.6 days out of 14). This metric provides valuable insights into team health, well-being, and potential workload distribution issues.
2. Definitions:
- Contributor: An individual who contributes code to the project repository.
- Contributor at Risk of Burnout: A contributor who exhibits code commit activity exceeding a predefined threshold, suggesting they might be working excessive hours.
- Predefined Threshold: The set limit for code commit activity that flags a contributor for potential burnout (e.g., 90% of a two-week window).
3. Explanation of Charts:
Detailed Chart
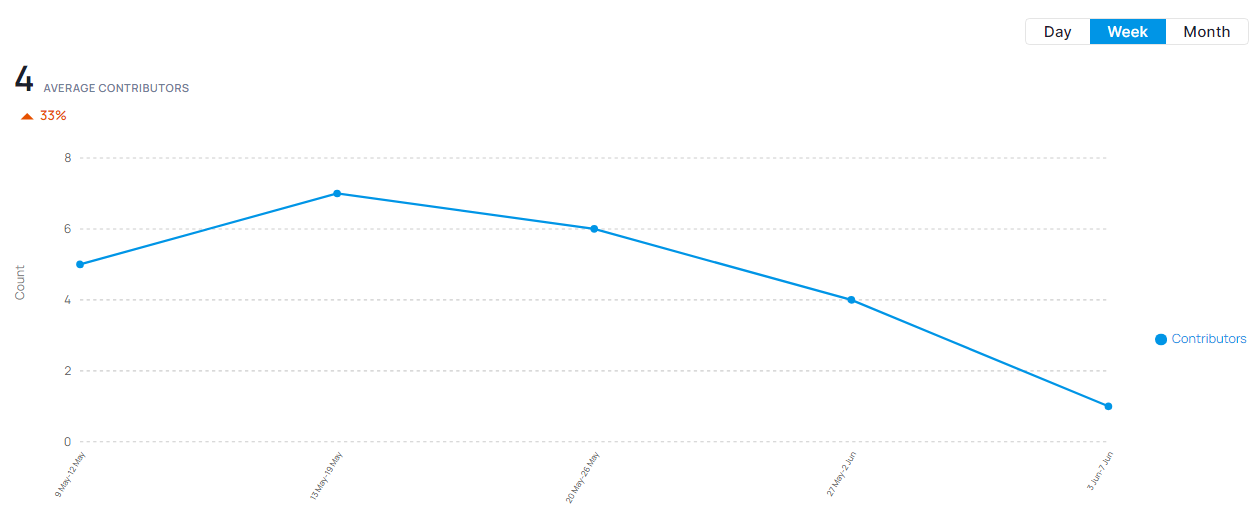
The line chart displays the average number of Contributors at Risk of Burnout over a chosen timeframe.
- Horizontal Axis: Represents time intervals (e.g., days, weeks, months).
- Vertical Axis: Represents the average number of contributors flagged for potential burnout.
- Trend Line: Shows the average rate of contributors exceeding the predefined threshold over time.
4. Interpretation:
Team Health and Well-being:
- Low Numbers: A consistently low number of contributors flagged for burnout suggests a healthy work-life balance within the team.
- Increasing Trend: An upward trend may indicate potential burnout risk for a growing number of team members, urging investigation into workload, deadlines, and potential stress factors.
Workload Management and Distribution:
- High Numbers: A sustained high level of contributors at risk might suggest workload pressure, tight deadlines, or workload imbalances within the team, leading some to overwork.
- Sudden Spikes: Short-term spikes in flagged contributors could be due to urgent fixes or project phases with intense activity. However, frequent occurrences warrant closer examination of workload distribution and project planning.
5. Key Points:
- Proactive Well-being Measures: Track Contributors at Risk of Burnout to proactively identify and address potential burnout before it impacts individual and team performance.
- Workload Insights: Monitor this metric to gain insights into workload distribution and identify areas where adjustments might be necessary to prevent overwork.
- Open Communication: Use this data as a starting point for open conversations within the team about workload, well-being, and potential solutions.
6. Conclusion:
Monitoring Contributors at Risk of Burnout provides valuable insights into team health, workload management, and potential work-life balance issues. By analyzing trends and taking corrective actions when necessary, you can promote healthy work practices, distribute workload effectively, and ensure sustainable team performance.
Additional Considerations:
- The interpretation of trends may depend on factors like project deadlines, team culture, and individual preferences.
- Consider using this metric in conjunction with other metrics (e.g., code churn, issue resolution time, Contributors Working on Non-Working Days) for a more comprehensive view of team well-being, workload management, and project health.
- Remember, context is crucial. While the metric flags potential risks, it's important to have open communication with team members to understand their working styles and preferences.