DORA Metrics
The DORA (DevOps Research and Assessment) metrics were contextualized in the annual State of DevOps reports, and the book Accelerate after years of groundbreaking research.
What is DORA metrics?
DORA (DevOps Research and Assessment) metrics are a set of key performance indicators used to evaluate and improve an organisation's DevOps practices. These metrics were developed by the DevOps Research and Assessment (DORA) team, now part of Google Cloud, to help companies measure their software delivery and operational performance. DORA metrics are tracked using four key metrics that engineering leaders can use to track the software delivery performance. These four metrics are:
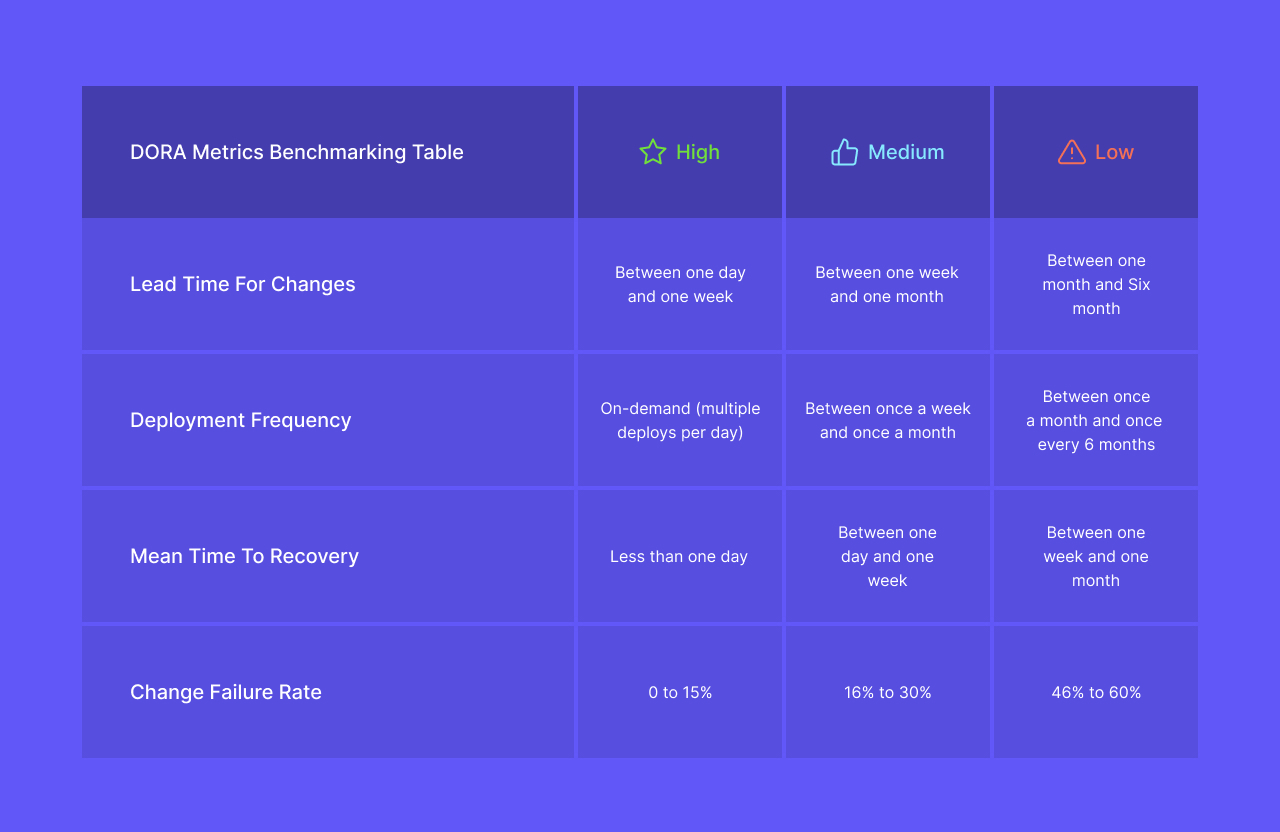
- Deployment Frequency
- Lead Time for Change
- Change Failure Rate
- Mean Time to Recovery
All four metrics have different benchmarks to show whether an organisation is an high performer or a low performer. You can check the table to determine where organisation falls`.
These four metrics provide insights into an organisation's ability to deliver software quickly, with reliability and efficiency. By tracking these metrics, companies can identify areas for improvement, optimize their DevOps processes, and ultimately achieve faster and more reliable software delivery, enhancing their overall competitiveness and customer satisfaction in today's fast-paced digital landscape.
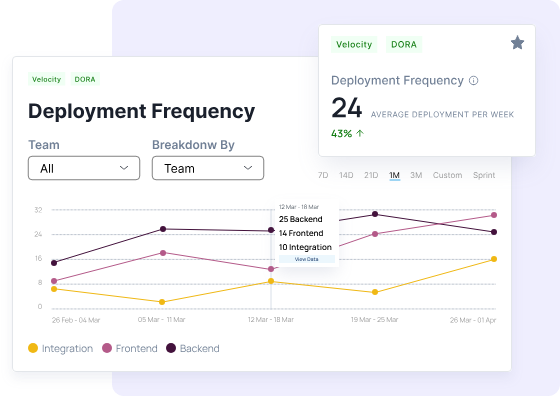
Deployment Frequency
This metric measures how often the code is deployed in production by the software team. Use our dashboard to see the number of deployments made per week/month.
Deployment frequency a key indicator of an organisation's agility and ability to respond to customer needs rapidly. High deployment frequency suggests that an organization can deliver changes quickly and efficiently, promoting innovation and responsiveness. On the other hand, a low deployment frequency may indicate bottlenecks or cumbersome processes that hinder agility. By tracking and optimizing deployment frequency, companies can adapt swiftly to market demands, reduce lead time for changes, and enhance their overall competitiveness in the ever-evolving technology landscape, all while maintaining high-quality software delivery.
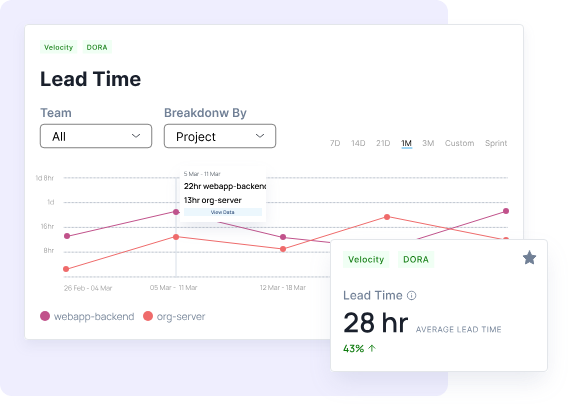
Lead Time to Change
Lead Time for Changes is the elapsed time between the first commit and the deployment to the final environment.
Lead Time to Change measures the time it takes to implement a change, from idea implementation to its deployment in a production environment. This metric is crucial for assessing an organisation's agility and efficiency in delivering software updates or new features. A shorter lead time indicates a more streamlined and responsive development process, enabling organizations to adapt swiftly to market demands. Conversely, a lengthy lead time may suggest inefficiencies that hinder innovation. By optimizing lead time to change, companies can accelerate their software delivery, enhance customer satisfaction, and stay competitive in today's fast-paced technological landscape.
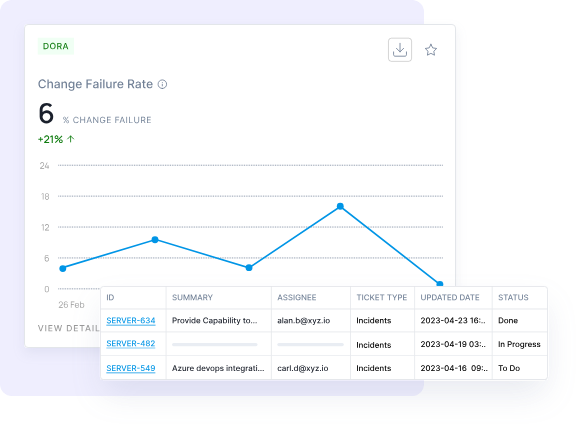
Change Failure Rate
Change Failure Rate measures the proportion of changes or deployments that result in errors, defects, or issues requiring remediation. This metric is critical for evaluating an organisation's ability to maintain system stability while delivering frequent updates. A high change failure rate may signify a lack of robust testing, automation, or quality control, leading to disruptions and customer dissatisfaction. Conversely, a low change failure rate indicates a mature and reliable DevOps process. By tracking and reducing the change failure rate, companies can improve software quality, minimize downtime, and build trust with customers, ultimately achieving more successful and smooth deployments.
The change Failure Rate is calculated by dividing the total number of production incidents by the total number of deploys in a given time period.
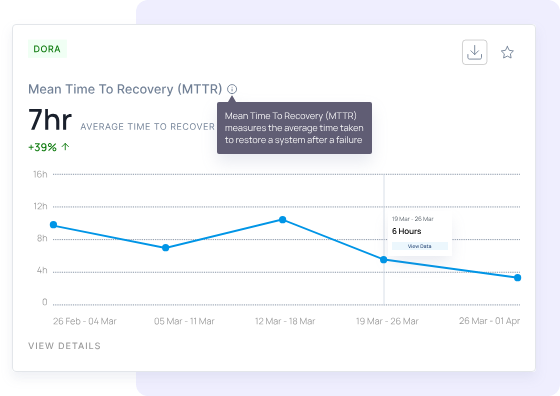
Mean Time to Recovery
Mean Time to Recovery measures the average time it takes to restore a system or service to normal operation after a failure or incident. A low MTTR indicates a highly efficient incident response and resolution process, minimising downtime and customer impact. Conversely, a high MTTR suggests inefficiencies and delays in addressing issues, which can lead to customer dissatisfaction and revenue losses. By tracking and improving MTTR, organizations can enhance their resilience, minimize service disruptions, and maintain a high level of customer satisfaction, ultimately bolstering their competitiveness in today's digital landscape.
The Mean Time to Recovery is the average Cycle Time (time between issue creation to issue resolution) of all incidents .
Why use DORA metrics?
With the help of the DevDynamics DORA Metrics, you and your team will be able to achieve:
- Automatic tracking of your team's DORA Metrics which ultimately help you in improving your software delivery speed.
- Evaluate your team's DORA Metrics against industry standards to identify potential areas for enhancement.
To get more details on DORA metrics please visit our blogs website