# Survey

## DevDynamics Surveys – Quick Start Guide

A simple, step-by-step guide to create, launch, and track your first survey.

## **Who is this for?**

Anyone setting up Surveys for the first time in DevDynamics

## **What you'll do**

1\) Open Survey Analytics, \
2\) Fill survey details \
3\) Pick questions (drivers)\
&#x20;4\) Create and launch the survey \
5\) Track outcomes in Analytics, Results, and Heatmap.

## **Step 1 — Open Survey Analytics**

Go to Survey in the left navigation. The Survey Analytics page opens. Click Create Your First Survey to get started.

<figure><img src="https://4171758421-files.gitbook.io/~/files/v0/b/gitbook-x-prod.appspot.com/o/spaces%2FS4rgvJ71tpXan8RhYTT4%2Fuploads%2FNStYezsN63gC9RawKOGc%2Fimage%20(164).png?alt=media&#x26;token=ffd632d8-9981-4fbe-a150-8628b1417e33" alt=""><figcaption></figcaption></figure>

&#x20;                    
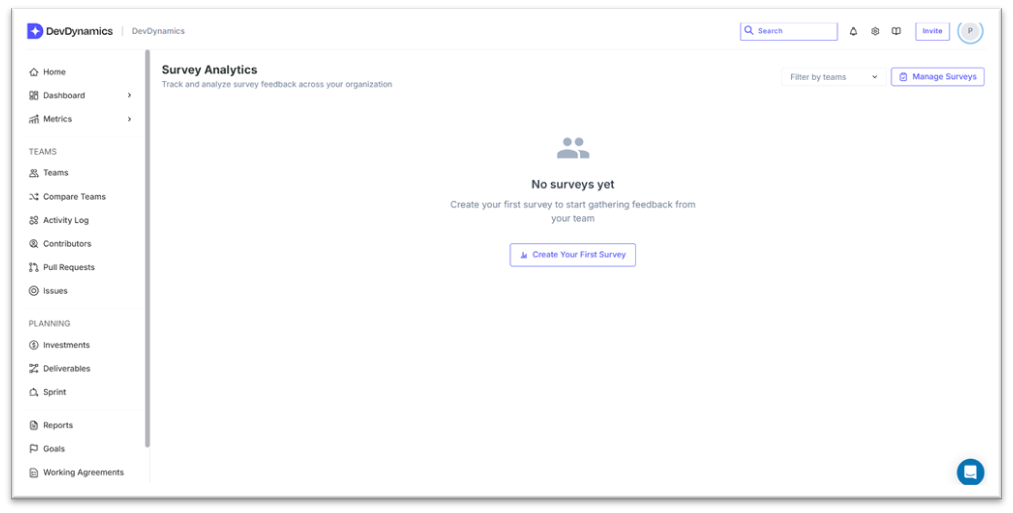
Figure 1. Survey Analytics — first-time view.

## **Step 2 — Fill Survey Details**

Enter the basic details: Survey Name, Description, Frequency (Weekly, Fortnightly, Monthly, Quarterly, Yearly, or Once), and Target Audience (select team(s)). Then pick the Developer Experience Drivers—the questions—grouped into Efficiency, Collaboration, and Learning & Growth.

<figure><img src="https://4171758421-files.gitbook.io/~/files/v0/b/gitbook-x-prod.appspot.com/o/spaces%2FS4rgvJ71tpXan8RhYTT4%2Fuploads%2FZFhI9HuNOffcVIf6s430%2Fimage%20(165).png?alt=media&#x26;token=bf04b7d8-af4d-490f-ba3d-26afba18a4b0" alt=""><figcaption></figcaption></figure>

&#x20;                                   
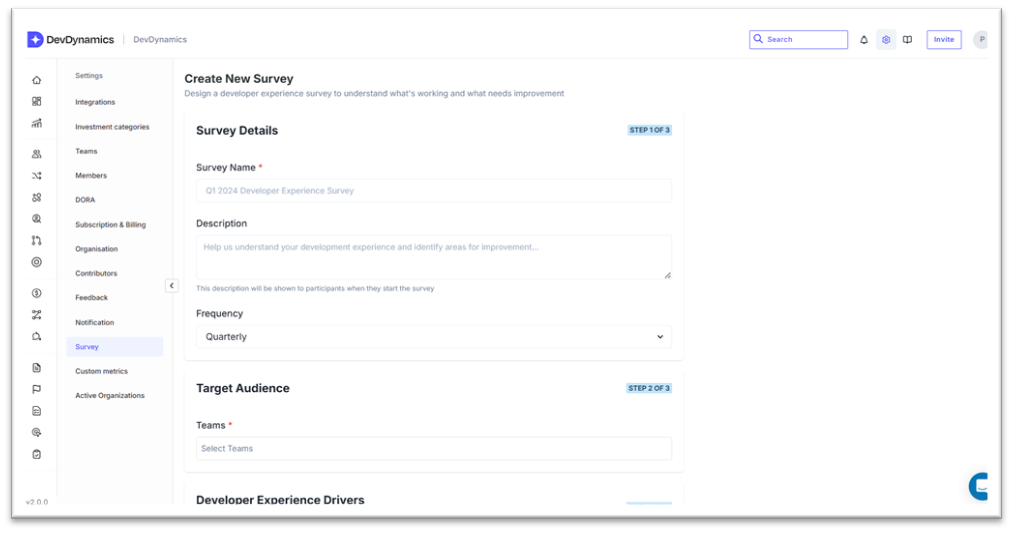
Figure 2. Survey Details form.

<figure><img src="https://4171758421-files.gitbook.io/~/files/v0/b/gitbook-x-prod.appspot.com/o/spaces%2FS4rgvJ71tpXan8RhYTT4%2Fuploads%2FmS3nZ8eCGARZAw7HRBbo%2Fimage%20(166).png?alt=media&#x26;token=8c6c2f43-dd56-4ee6-94a5-cdb80e695f92" alt=""><figcaption></figcaption></figure>

&#x20;          
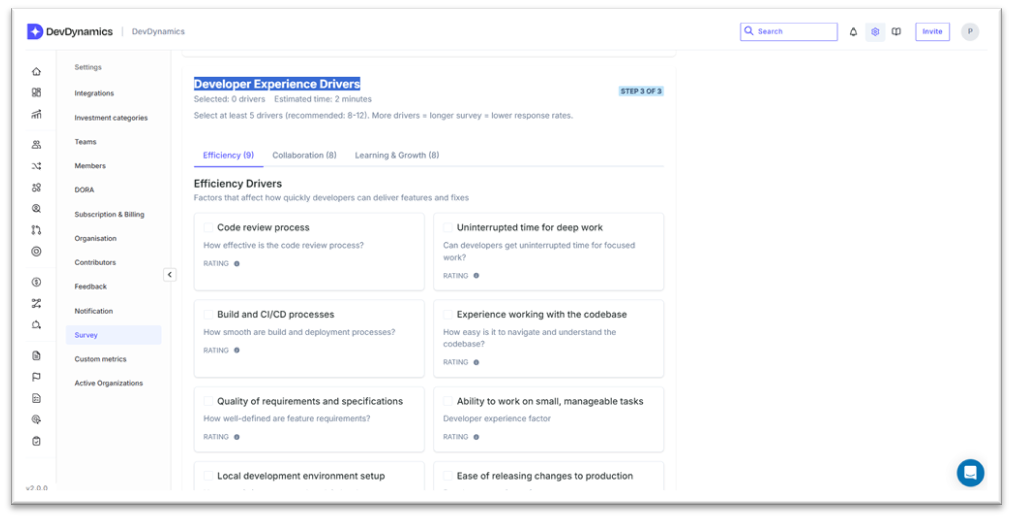
Figure 3. Choose questions from the three driver categories.

## **Step 3 — Select at least 5 questions**

You must select at least five drivers (questions) to enable the Create Survey button. You can mix questions from any of the three tabs.

<figure><img src="https://4171758421-files.gitbook.io/~/files/v0/b/gitbook-x-prod.appspot.com/o/spaces%2FS4rgvJ71tpXan8RhYTT4%2Fuploads%2FG0eBmpx4gvQhHwGL1RNL%2Fimage%20(175).png?alt=media&#x26;token=9602dd67-dd61-45c8-b9b0-e1bed8a744d7" alt=""><figcaption></figcaption></figure>

<p align="center">
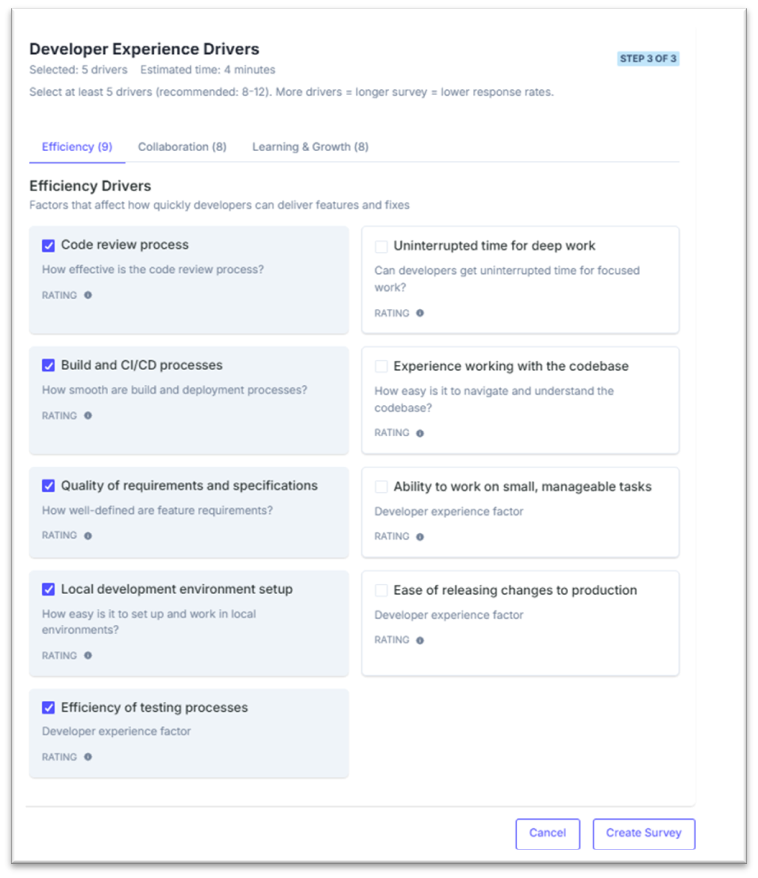
Figure 4. Minimum five drivers selected — Create Survey becomes active.</p>

## **Step 4 — Survey created**

After clicking Create Survey, you’ll see a success message and the survey appears under Survey Setup as a draft.

<figure><img src="https://4171758421-files.gitbook.io/~/files/v0/b/gitbook-x-prod.appspot.com/o/spaces%2FS4rgvJ71tpXan8RhYTT4%2Fuploads%2Fcq8dvyphgSsGaNxmIwxr%2Fimage%20(167).png?alt=media&#x26;token=54ef1506-1c39-44c1-8827-84b5b828c953" alt=""><figcaption></figcaption></figure>

<p align="center">
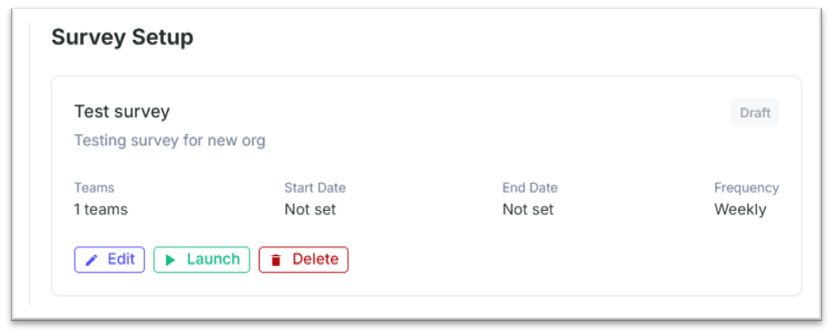
Figure 5. Survey Setup card (Draft).</p>

## **Step 5 — Launch the survey (set dates)**

Click Launch. Pick a Start Date and End Date.

• The Start Date must be tomorrow or later.

• Choose a date range that matches the Frequency you selected.

<figure><img src="https://4171758421-files.gitbook.io/~/files/v0/b/gitbook-x-prod.appspot.com/o/spaces%2FS4rgvJ71tpXan8RhYTT4%2Fuploads%2FvcG5WsXIq93nafXYDRE1%2Fimage%20(168).png?alt=media&#x26;token=d3c75358-8139-47b7-8b29-5ef67ae2acde" alt=""><figcaption></figcaption></figure>

<p align="center">
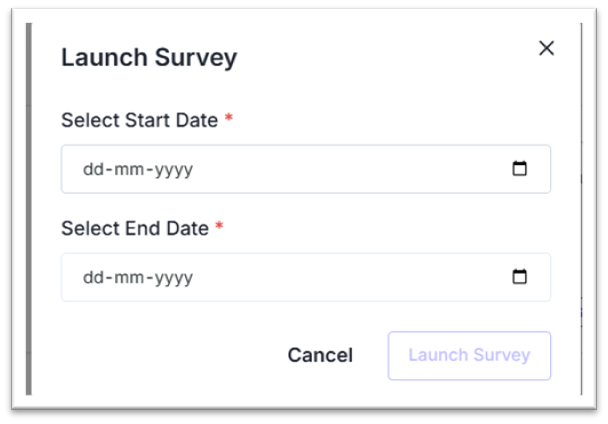
Figure 6. Launch modal — choose start and end dates.</p>

Once launched, the survey shows Launched status. You’ll see options to Pause or Close the survey at any time.

<figure><img src="https://4171758421-files.gitbook.io/~/files/v0/b/gitbook-x-prod.appspot.com/o/spaces%2FS4rgvJ71tpXan8RhYTT4%2Fuploads%2F0gQ2RbXU6kZSwJ1UDm5G%2Fimage%20(169).png?alt=media&#x26;token=f1401088-97b5-449a-a11d-38d054287c06" alt=""><figcaption></figcaption></figure>

<p align="center">
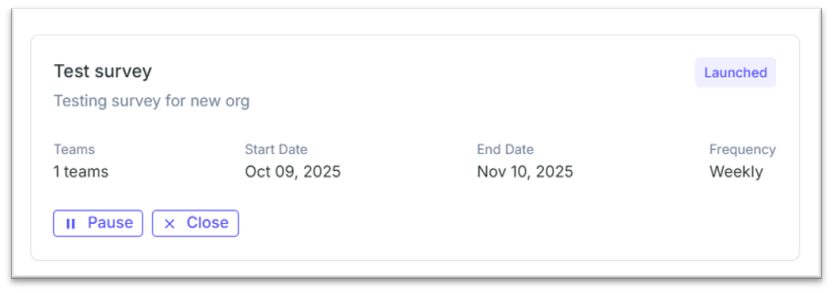
Figure 7. Survey Setup card (Launched).</p>

## **Step 6 — Email invite**

Participants receive a unique email invite with a button to take the survey, based on the start date you set.

<figure><img src="https://4171758421-files.gitbook.io/~/files/v0/b/gitbook-x-prod.appspot.com/o/spaces%2FS4rgvJ71tpXan8RhYTT4%2Fuploads%2FdrG5vfD4R2hy7RnoEhsU%2Fimage%20(170)-redacted_dot_app.png?alt=media&#x26;token=efe3f347-3cef-4726-8e86-71f9f4f38769" alt=""><figcaption></figcaption></figure>

<p align="center">
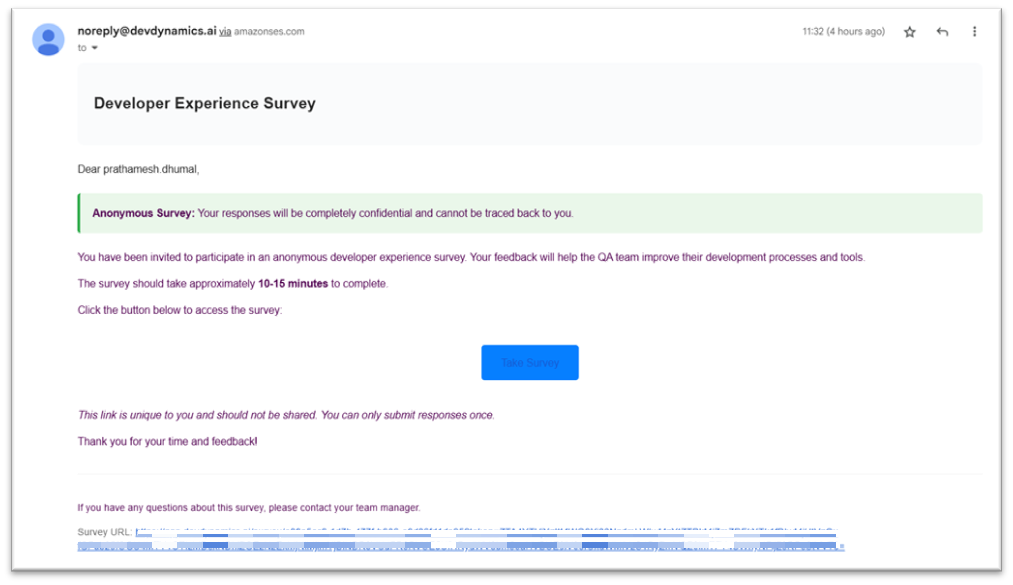
Figure 8. Email invite — unique link per recipient.</p>

## **Step 7 — Reminder emails**

If someone hasn’t responded, reminder emails are sent automatically.

<figure><img src="https://4171758421-files.gitbook.io/~/files/v0/b/gitbook-x-prod.appspot.com/o/spaces%2FS4rgvJ71tpXan8RhYTT4%2Fuploads%2Fk9HwNx5G0Tx2MplflKUu%2Fimage%20(171)-redacted_dot_app.png?alt=media&#x26;token=c3ebe376-73ea-434e-843f-5184c05d81a7" alt=""><figcaption></figcaption></figure>

<p align="center">
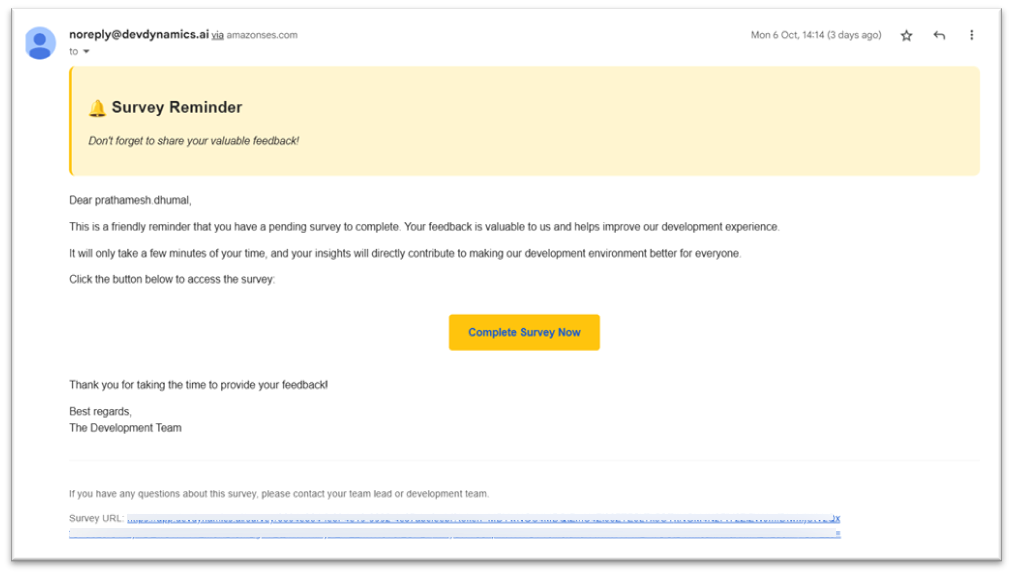
Figure 9. Reminder email.</p>

## **Reminder timing (in simple terms)**

For Weekly, Monthly, or Quarterly surveys:

• First reminder is sent on Day 3 after the survey starts.

• Second reminder is sent on Day 5, only if the first one was already sent and there’s still no response.

For Once surveys:

• First reminder is sent when 40% of the survey window has passed.

• Second reminder is sent when 70% has passed, only if they still haven’t responded.

## **Step 8 — Monitor Survey Analytics**

The Analytics page shows three quick views:

• Survey Info — cycle, date range, teams, and status (Active).

• Participation — responses out of total sent (e.g., 6/6).

• Top Priority — the driver that needs attention based on responses.

<figure><img src="https://4171758421-files.gitbook.io/~/files/v0/b/gitbook-x-prod.appspot.com/o/spaces%2FS4rgvJ71tpXan8RhYTT4%2Fuploads%2FnMBb9bz5i9ljxFgR69o1%2Fimage%20(172).png?alt=media&#x26;token=f0d37ab2-ff49-4871-90c3-06d99458420b" alt=""><figcaption></figcaption></figure>

<p align="center">
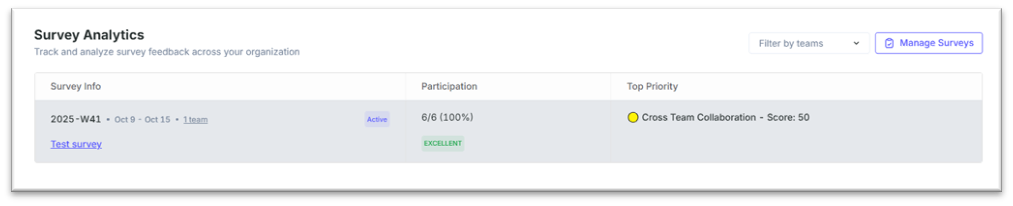
Figure 10. Survey Analytics — info, participation, and top priority.</p>

## **Step 9 — Dive into Results & Heatmap**

Open a survey to see detailed results:

• Results tab — Priority order, Driver name, Response Breakdown, Sentiment, and Comments.

<figure><img src="https://4171758421-files.gitbook.io/~/files/v0/b/gitbook-x-prod.appspot.com/o/spaces%2FS4rgvJ71tpXan8RhYTT4%2Fuploads%2F9k9i2slZJmCxkKloXdg5%2Fimage%20(173).png?alt=media&#x26;token=7c0ac8fa-7773-481e-9d0d-5d46f071e9ae" alt=""><figcaption></figcaption></figure>

<p align="center">
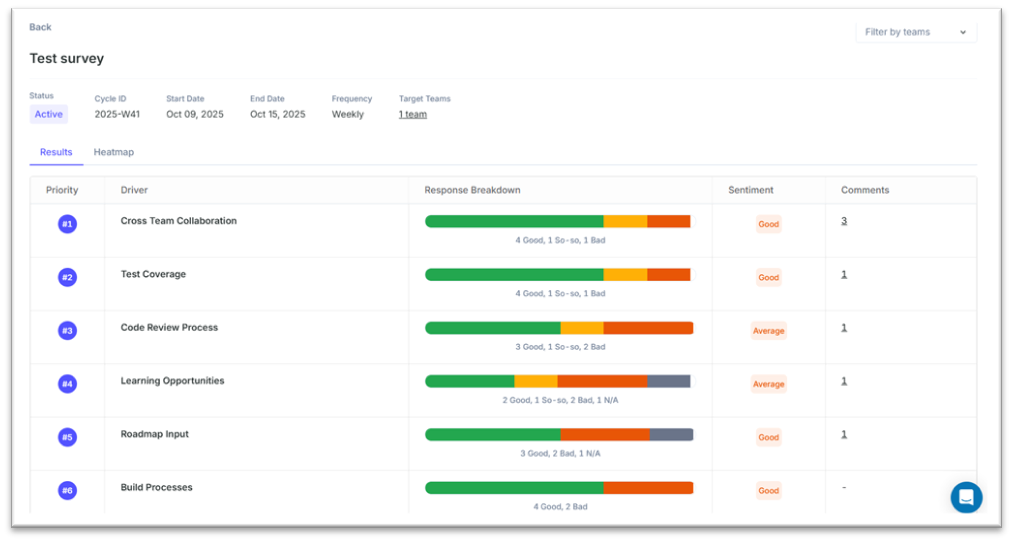
Figure 11. Results tab — focus areas and response mix.</p>

• Heatmap tab — scores by team and driver; hover a cell to see score and counts.

<figure><img src="https://4171758421-files.gitbook.io/~/files/v0/b/gitbook-x-prod.appspot.com/o/spaces%2FS4rgvJ71tpXan8RhYTT4%2Fuploads%2FWiGE1SiZSuXqswz4y6f7%2Fimage%20(174).png?alt=media&#x26;token=2b186a59-b06e-4708-8e96-d968075ea6cb" alt=""><figcaption></figcaption></figure>

<p align="center">
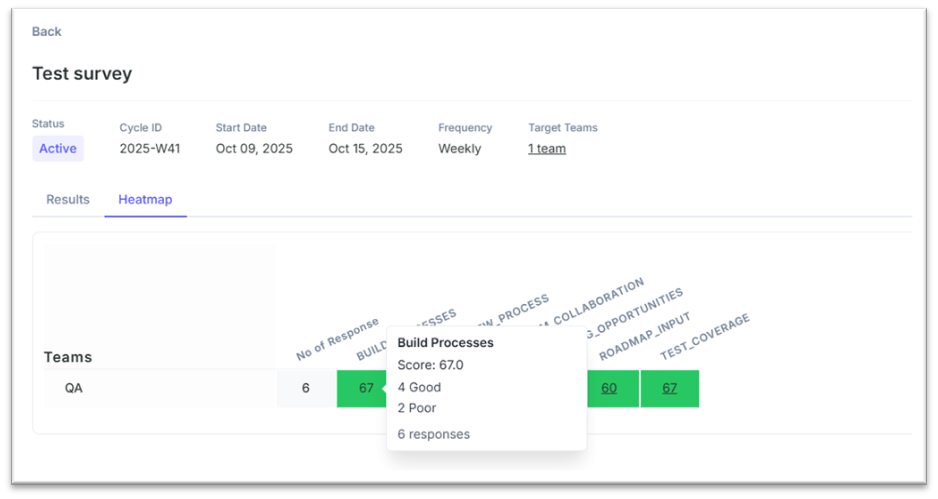
Figure 12. Heatmap — team × driver with hover details.</p>

## **You’re  done**

Your first survey is live and you can track outcomes in Analytics, Results, and Heatmap.
