Issue Closed Count / Task Velocity
Introduction
This section explains how to analyze and visualize completion rates using the Issue Closed Count or Task Velocity metric, represented as a line chart tracking issues or tasks closed over time at daily, weekly, or monthly intervals. The metric offers insights into team productivity, workload management, and workflow bottlenecks.
Definitions
- Issue/Task: A unit of work representing a bug, feature request, or other work item in your project management system.
- Issue Closed Count/Task Velocity: The number of issues or tasks closed within a specific timeframe (day, week, or month).
Explanation of Charts
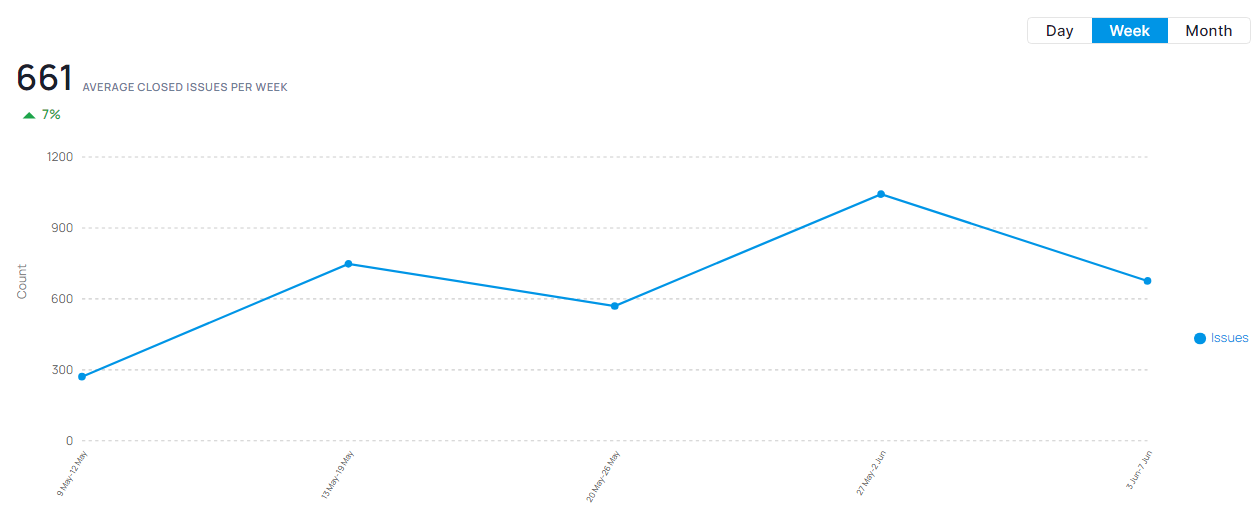
The line chart displays closure counts over a chosen timeframe with:
- Horizontal Axis: Time intervals (days, weeks, months)
- Vertical Axis: Number of issues or tasks closed
- Trend Line: Average rate of closure over time
Interpretation
Identifying Trends: The line chart visualizes completion rate patterns.
- Increasing Trend: Rising completion suggests enhanced team productivity or improved workflow efficiency.
- Decreasing Trend: Falling completion may signal bottlenecks, reduced team capacity, or increased issue complexity.
- Flat Trend: Consistent performance, though potentially indicating stagnation or stable workload conditions.
Key Points
- Productivity Monitoring: Track this metric to evaluate team productivity and workload distribution.
- Identifying Bottlenecks: Analyze trends to spot areas where resolution speed is declining.
- Work Management: Monitor to maintain balance between workload and team resources.
Conclusion
Tracking Issue Closed Count/Task Velocity reveals your team's issue resolution efficiency. Analyzing trends enables workflow optimization, productivity improvement, and identifies enhancement opportunities.
Additional Considerations:
- Trend interpretation depends on project phase, resource availability, and issue complexity.
- Combine this metric with others like cycle time and work-in-progress for comprehensive workflow health assessment.